
- Title
-
Differences in cardiovascular toxicities associated with cigarette smoking and snuff use revealed using novel zebrafish models
- Authors
- Folkesson, M., Sadowska, N., Vikingsson, S., Karlsson, M., Carlhäll, C.J., Länne, T., Wågsäter, D., Jensen, L.
- Source
- Full text @ Biol. Open

Developmental toxicities of cigarette smoke and snuff extracts. (A) Bright-field micrographs of zebrafish embryos at 24 or 48hours post-fertilization (hfp) treated with nothing (control) or various concentrations of cigarette smoke (CS) or snuff extracts. Areas indicated by black boxes in the upper two rows are enlarged in the third row. Brain hemorrhages are highlighted by green arrowheads. (B) Quantification of the proportion of CS or snuff extract-treated embryos that survived to the 24hpf stage. n=40 for the undiluted CS and snuff groups, 120 for control groups and 80 embryos for all other groups. CS: P<5.1×10⁻¹¹, snuff: P<9.6×10⁻¹⁰ by single-factor ANOVA. *P<0.05, ***P<0.001 comparing each concentration of tobacco extract to its own control. (C) Quantification of the proportion of CS or snuff extract-treated embryos that survived to the 48hpf stage. n=40 for the undiluted CS and Snuff groups, 120 for control groups and 80 embryos for all other groups. CS: P<7.7×10⁻⁹, snuff: P<4.1×10⁻⁹ by single-factor ANOVA. *P<0.05, ***P<0.001 comparing each concentration of tobacco extract to its own control. (D) Quantification of the proportion of non-treated, CS extract-treated or snuff extract-treated embryos hatched at the 72hpf stage. n=15 embryos. (E) Average stage translated to time-after-fertilization of embryos treated with CS or snuff extracts evaluated 24hpf. n=36 embryos for control (0), 38, 36, 34, 30 and 29, or 35, 30, 36 and 34 embryos for increasing concentrations of snuff or CS, respectively. CS: P>0.05, snuff: P<7.5×10⁻⁷ by single-factor ANOVA. *P<0.05, ***P<0.001. (F) Average stage translated to time-after-fertilization of embryos treated with CS or snuff extracts evaluated 48hpf. n=36 embryos for control (0), 37, 32, 29 and 28, or 35, 30, 36 and 34 embryos for increasing concentrations of snuff or CS, respectively. CS: P>0.05, snuff: P<3.2×10⁻²⁵ by single-factor ANOVA. ***P<0.001. (G) Quantification of the proportion of CS extract-treated or snuff extract-treated embryos exhibiting obvious bleedings in the brain (brain hem.) at 48hpf. n=80 embryos. SC: P<0.018, snuff: P<6.3×10⁻⁴ by single-factor ANOVA. *P<0.05, **P<0.01, ***P<0.001. (H) Bright-field micrographs of zebrafish embryos at 24 or 48hpf treated with 0.5mg/l nicotine. Areas indicated by black boxes in left column are enlarged in the right column. (I) Quantification of the proportion of nicotine-treated embryos that survived to the 24 or 48hpf stages. n=120 embryos for control (0) and 80, 40 or 40 for increasing concentrations of nicotine. P<0.015 by single-factor ANOVA. (J) Average stage translated to time-after-fertilization of embryos treated with nicotine evaluated 24 or 48hpf. n=36 embryos for control (0) and 35, 34, 34, 32, 32, 37 and 35, or 35, 34, 31, 32, 31, 36 and 34 embryos at 24hpf or 48hpf, respectively. P>0.05 by single-factor ANOVA. All experiments were repeated twice with similar results. Results are shown as means±s.e.m. and statistical evaluation as indicated by asterisks was done using Student’s two-tailed t-test assuming equal variance between the groups. |
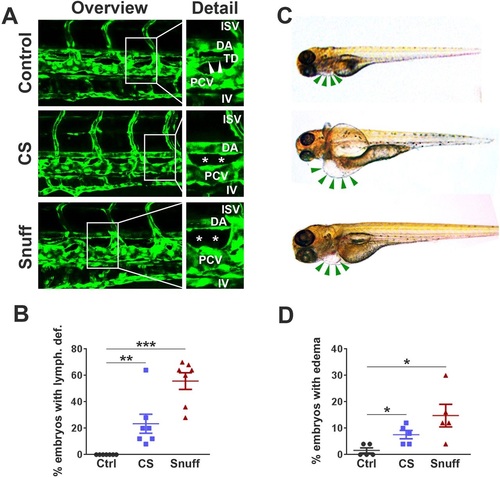
Defective development of lymphatic vessels in zebrafish embryos treated with cigarette smoke extract or snuff extract. (A) Confocal micrographs of the central trunk region in fli1a:EGFP transgenic zebrafish at 4days post-fertilization (dpf) treated with nothing (control), cigarette smoke extract (CS) at 1:30 dilution or snuff extract at 1:50 dilution. White boxes in the left column represent the areas enlarged in the right column. ISV, inter-segmental vessel; DA, dorsal aorta; TD, thoracic duct; PCV, posterior cardinal vein; IV, intestinal vein. White stars represent the area in which the thoracic duct should have appeared but is lacking. (B) Quantification of the proportion of non-treated, CS extract-treated or snuff extract-treated embryos with an absent or major defect in TD development at 4dpf. n=160 embryos. **P<0.01, ***P<0.001. (C) Bright-field micrographs of zebrafish larvae at 4dpf treated with nothing (top image), CS extract (middle image) or snuff extract (bottom image). Green arrows indicate the pericardium, with pericardial edema visible in the CS and snuff groups. (D) Quantification of the proportion of non-treated, CS extract-treated or snuff extract-treated embryos with pericardial edema at 4dpf. n=110 embryos. *P<0.05. All experiments were repeated twice with similar results. Results are shown as means±s.e.m. and statistical evaluation was done using Student’s two-tailed t-test assuming equal variance between the groups. EXPRESSION / LABELING:
|

Lowered heart rate, ventricular dimensions, stroke volume and cardiac output in zebrafish embryos treated with cigarette smoke or snuff extracts. (A) Still images from a microscope video of a zebrafish larvae at 3days post-fertilization (dpf). The area indicated by a red box in the image to the left is enlarged and shown at end systole or end diastole in the middle or right images, respectively. A, Atrium; rl, long-axis radius; rs, short-axis radius; V, volume. (B,C) Quantification of the average volume of the ventricle at systole (B) or diastole (C) in 3dpf embryos treated with nothing, cigarette smoke extract at 1:30 dilution (CS), snuff extract at 1:50 dilution (Sn) or the anesthetic tricaine (Tri) at 0.2mg/ml. n=10, 3, 9 and 5 embryos (three measurements per embryo) in the control, CS, SN and Tri groups respectively. *P<0.05, ***P<0.001. (D) Quantification of the stroke volume in picoliters (pl) of the same 3dpf embryos as in B and C. **P<0.01, ***P<0.001. (E) Quantification of the average heart rate in beats per minute (beats/min) of the same 3dpf embryos as in B and C. **P<0.01, ***P<0.001. (F) Quantification of the cardiac output in nanoliters per minute (nl/min) of the same 3dpf embryos as in B and C. **P<0.01, ***P<0.001. The experiment was repeated with similar results. Results are shown as means±s.e.m. and statistical evaluation was done using Student’s two-tailed t-test assuming equal variance between the groups. |

Abdominal aortic aneurysm formation in zebrafish embryos following treatment with Angiotensin II or snuff extract. (A) Confocal micrographs of the central trunk region in fli1a:EGFP embryos at 4 days post-fertilization (dpf) either non-treated (control), injected at the 1-cell stage with 50ng angiotensin II (AngII) in the yolk, or treated with cigarette smoke extract (CS) at 1:30 dilution or snuff extract at 1:50 dilution from the 2dpf stage. The aorta is highlighted in a magnified image under the overview image and the abdominal (anterior) and distal (posterior) parts of the aorta further magnified in the left and right images, respectively, under the isolated aorta image. Red dots outline the aortic wall. Scale bars: 100 µm, 50µm and 50µm in the overview, aorta highlight and posterior aorta highlight images, respectively. (B) Quantification of the average aorta diameter in the abdominal region (anterior aorta images shown in A) of control zebrafish embryos during development. n=20, 9, 20, 19 and 12 embryos at 24, 48, 72, 98 and 120hpf, respectively. *P<0.05, ***P<0.001. (C) Quantification of the average aorta diameter in the abdominal region (anterior aorta images shown in A) of zebrafish embryos treated with CS, snuff or AngII as in A. n=19, 7, 7 and 13 in the control, CS, Sn and AngII groups respectively. **P<0.01, ***P<0.001. All experiments were repeated twice with similar results. Results are shown as means±s.e.m. and statistical evaluation was done using Student’s two-tailed t-test assuming equal variance between the groups. EXPRESSION / LABELING:
|