
- Title
-
Radial glia inhibit peripheral glial infiltration into the spinal cord at motor exit point transition zones
- Authors
- Smith, C.J., Johnson, K., Welsh, T.G., Barresi, M.J., Kucenas, S.
- Source
- Full text @ Glia

Peripheral and central myelinating glia are segregated at the MEP. A: Schematic of a zebrafish larvae with the brain and spinal cord labeled in red. Boxed region shows the spinal motor nerve roots, which are magnified in B. B: Schematics of spinal motor roots at 24, 48, and 72 hpf showing motor axons (red), PNS glia (green) and CNS glia (yellow). Images of Tg(sox10:eos);Tg(olig2:dsred) embryos at (C) 24, (D) 48 (E), and 72 hpf. Lateral and cross section (90°) views are shown. Arrows denote peripheral sox10+ glia and arrowheads denote central sox10+/olig2+ OPCs. Asterisks at 48 and 72 hpf denote Eos expression in spinal cord neurons. Dotted lines represents spinal cord boundary. Scale bar, 25 µm. |
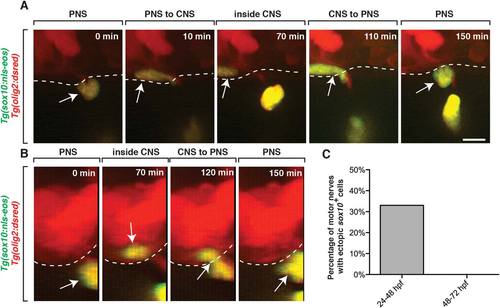
sox10+ peripheral cells migrate into the spinal cord during early nervous system development. A: Images from a 24 h time-lapse movie starting at 24 hpf of a Tg(sox10:nls-eos);Tg(olig2:dsred) embryo. Arrows denote a peripheral sox10+ cell that entered the spinal cord and then quickly exited. Dashed line denotes edge of spinal cord. B: 90-degree digital rotation of images from movie shown in A. C: Percentage of the number of nerves that had peripheral sox10+ cells enter the spinal cord and then exit (n = 9). Scale bar, 25 µm. |

OPCs do not restrict ectopic peripheral glial migration. A: Images from 24, 48, and 72 hpf Tg(olig2:dsred) embryos stained with antibodies specific to acetylated tubulin (green) and Sox10 (blue). Arrows show peripheral Sox10+ cells while arrowheads denote centrally-located Sox10+ cells. B: Quantification of the location of Sox10+ OPCs in the spinal cord at 48 hpf. C: Images from a 24 h time-lapse movie starting at 48 hpf of a Tg(sox10:eos) embryo treated with TSA at 36 hpf. Arrows denote PNS glia that do not migrate into the spinal cord. Asterisks indicate sox10+ neurons that are labeled by Tg(sox10:eos). Dashed lines and circles denote boundary of spinal cord. Scale bars, 25 µm. |
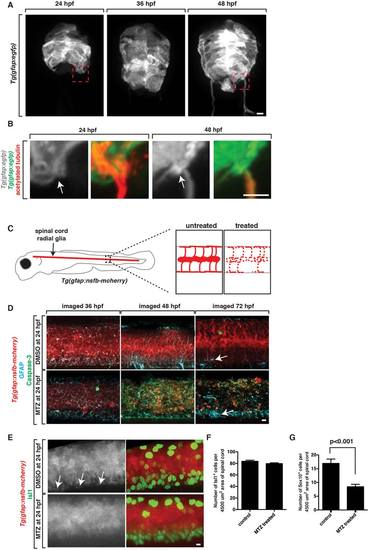
Radial glial cells are specifically ablated in Tg(gfap:nsfB-mcherry) embryos. A: Images from Tg(gfap:egfp) embryos at 24, 36, and 48 hpf. Box denotes location of MEP TZ shown in B. B:. Zoomed images of Tg(gfap:egfp) embryos stained with an antibody to acetylated tubulin to mark motor axons. Arrow denotes location of MEP. C: Schematic of Tg(gfap:nsfB-mcherry) embryo with zoomed-in views of the spinal cord in untreated and MTZ-treated animals showing death (dashed lines) of radial glial cells in MTZ-treated animals. D: Confocal images of Tg(gfap:nsfB-mcherry) animals treated with DMSO or MTZ at 24 hpf and fixed and stained with antibodies specific to GFAP and Caspase-3 at 36, 48, and 72 hpf. Arrow denotes floorplate radial glia that do not express NTR and are present after MTZ-treatment. E: Confocal images of Tg(gfap:nsfB-mcherry) animals treated with DMSO or MTZ at 24 hpf and fixed and stained with antibodies specific to Isl1 and Sox10 at 56 hpf. Images show mcherry+ endfeet (denoted with arrows) in control animals that are absent in MTZ-treated animals. Quantification of (F) Isl1+ motor neurons (G) and Sox10+ glia in the spinal cord at 56 hpf in DMSO and MTZ-treated embryos. Scale bars, 25 µm. |
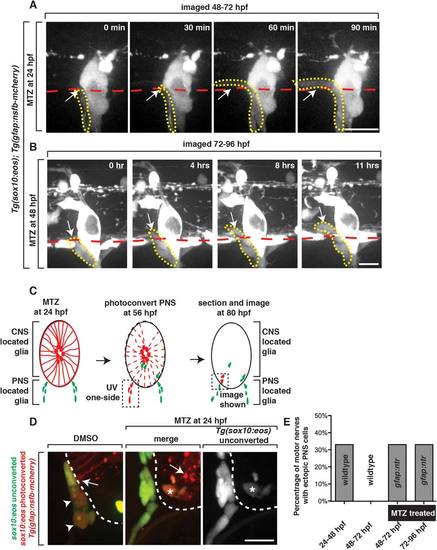
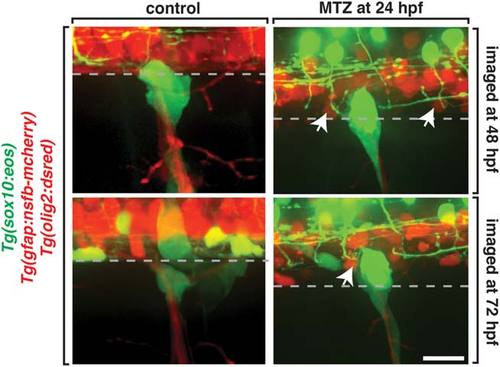
Radial glia are required to restrict ectopic peripheral glial migration into the spinal cord. A: Images from a 24-h time-lapse of a Tg(sox10:eos) embryo treated at 24 hpf with MTZ and imaged from 48 to 72 hpf. Arrow denotes peripheral sox10+ cell that migrated into the spinal cord. Red dashed line denotes the edge of the spinal cord. Yellow dashed line denotes ectopically migrating PNS cell. B: Images from a 24-h time-lapse of a Tg(sox10:eos) embryo treated at 48 hpf with MTZ and imaged from 72 to 96 hpf. Arrow denotes peripheral sox10+ cell that migrated into the spinal cord. Red dashed line denotes the edge of the spinal cord. Yellow dashed line denotes ectopically migrating PNS cell. C: Schematic of the use of Eos photoconversion to demonstrate that peripheral sox10+ cells enter the spinal cord. PNS located glia at 48 hpf were photoconverted. D: In the experiment outlined in C, unconverted (green) and converted (red) Eos is shown in DMSO and MTZ-treated animals. Only in MTZ-treated animals are converted (red cells with asterisk) ectopically observed within the spinal cord. Arrowheads denote converted cells in controls that did not enter the spinal cord. Arrows denote radial glia endfeet in DMSO-treated animals and radial glia debris in MTZ-treated animals. Note that the ectopic cell in MTZ-treated animals also express unconverted Eos, distinguishing it from mcherry+ debris. E: Quantification of data from A and B showing the number of times a nerve had a cell ectopically migrate into the spinal cord (n = 6). Scale bars, 25 µm. |
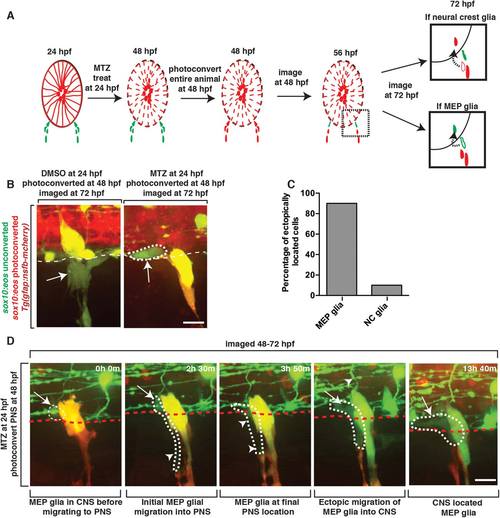
MEP glia migrate into the spinal cord after radial glial ablation. A: Schematic of the use of Eos photoconversion to differentially label MEP glia vs neural crest-derived cells. Both potential outcomes are shown at 72 hpf. Arrow denotes migration path of a PNS cell (outlined cell) that has ectopically entered the spinal cord (solid cells). Red cells denote neural crest-derived cells while green cells denote MEP glia. B: Images of a Tg(sox10:eos);Tg(gfap:nsfB-mcherry) embryo that was treated at 24 hpf with MTZ, photoconverted at 48 hpf and then imaged at 72 hpf. Dotted circle denotes ectopically located sox10+ cell that is unconverted. C: Quantification of experiment described in A and shown in B. D: Images taken from a 24 hour time-lapse of a Tg(sox10:eos) embryo, imaged from 48 to 72 hpf, showing an unconverted Eos+ cell migrating out of the spinal cord and then back in. Dotted circle marks the cell that ectopically re-enters the spinal cord. Arrow marks the part of the cell that is in the CNS while arrowheads marks the PNS-located side of the cell. Scale bars, 25 µm. |

Ectopically located MEP glia do not elicit an immune response. A: Images of control and MTZ-treated Tg(mpeg:egfp);Tg(gfap:nsfB-mcherry) and Tg(pU1:egfp);Tg(gfap:nsfB-mcherry) larvae at 3 dpf. Arrowheads denote macrophages outside of the spinal cord. Arrow denotes microglia inside the spinal cord. Dashed lines denote the edge of the spinal cord. B: Transverse sections through Tg(pU1:egfp) embryos that were fixed at 5 dpf and stained with an antibody specific to acetylated tubulin. Arrow denotes location of microglia. C: Images of a Tg(pU1:egfp);Tg(gfap:nsfB-mcherry) embryo treated with MTZ at 24 hpf and imaged at 5 dpf. Arrows denote microglia. Note the lack of mcherry+ debris. D: Quantification of the location of microglia and ectopically located MEP glia within the spinal cord in MTZ-treated embryos at 3 and 5 dpf. Scale bars, 25 µm. |
Radial glia selectively gate entrance into the spinal cord. Images of control and MTZ-treated Tg(sox10:eos);Tg(olig2:dsred);Tg(gfap:nsfB-mcherry) embryos. Arrows denote olig2+ cells within the spinal cord. Dashed line denotes the edge of the spinal cord. Scale bar, 25 µm. |

Supporting Information Figure S1 |