
- Title
-
Heme Oxygenase-1 Protects Corexit 9500A-Induced Respiratory Epithelial Injury across Species
- Authors
- Li, F.J., Duggal, R.N., Oliva, O.M., Karki, S., Surolia, R., Wang, Z., Watson, R.D., Thannickal, V.J., Powell, M., Watts, S., Kulkarni, T., Batra, H., Bolisetty, S., Agarwal, A., Antony, V.B.
- Source
- Full text @ PLoS One
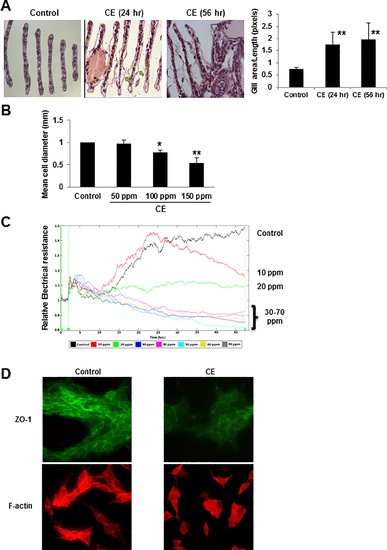
Morphological changes, reduction in cell diameter, permeability increase and disruption of intercellular junctions induced by CE. (A) Gills of zebrafish were exposed to either CE (150 ppm) or held as controls for 24 hours or 56 hours and stained with H&E. Digital micrographs were obtained at 20 x magnifications. Arrows point to edema and blebbing of gill epithelium. The ratios of gill area/gill length were calculated using Image Software (NIH, Bethesda, MD, USA) and presented as 1-dimensional area measurements. Data is quantified and shown as mean ± SD of three independent experiments. ** p < 0.01 vs control by a one-way ANOVA with HSD test. (B) Cell diameter measurements. BEAS-2B cells were grown to confluence in 65 mm dishes and exposed to 0 to 150 ppm of CE for 2 hours (n = 3). Data are shown as a mean ± SD. * p < 0.05 and ** p < 0.01 vs control by a one-way ANOVA with HSD test. (C) Permeability measurement of the bronchial epithelium of the airway. The sub-acute response to CE exposure was modeled by ECIS. BEAS-2B cells were seeded into the ECIS array. Cells were allowed to cover the gold electrodes in each well of the array prior to exposure to CE (0 ppm to 70 ppm). Real-time measurements of the electric resistance of the bronchial epithelial monolayers were obtained at 64 kHz. Resistance measurements were normalized with respect to the values in each well 1 hour prior to the initiation of the exposure. This time period corresponded to 16 hours after the seeding of the cells and was designated as t = 0 hour in the graph. The data are representative of three independent experiments. (D) BREA-2B cells were culture with or without 100 ppm CE for 1 hour. Protein expression of ZO-1 and actin filaments was detected using immunofluorescence microscopy (original magnification, ×40) with rabbit anti-ZO-1 (green) and phalloidin (red). Representative images captured from BEAS-2B cells are shown. |
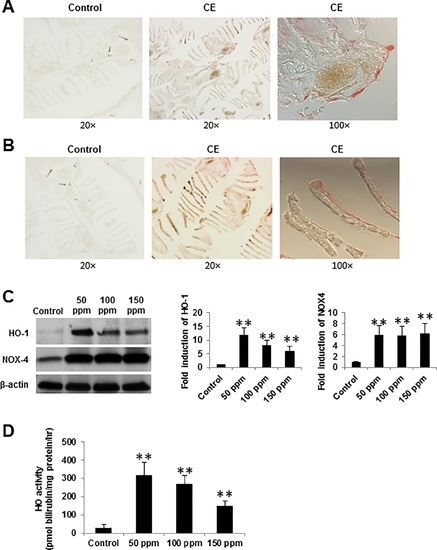
Upregulation of HO-1 and NOX4 in response to CE stimulation. Zebrafish were exposed to either CE 150 ppm or control for 56 hours and IHC analysis was performed for HO-1 (A) and NOX4 (B) expression. CE exposure is accomplished by holding adult zebrafish in 1 liter borosilicate class beakers (acid washed, followed with neutralizing alkali) to eliminate any potential reaction of the CE with plastic. (C) Cell lysates from BEAS-2B cells were analyzed by western blotting with anti-HO-1 and NOX4 antibodies at different concentrations of CE for 4 hours. β-actin was used as loading control. For quantification of the HO-1 and NOX4 expression, membranes were scanned and the bar graphs illustrated the relative expression of HO-1 and NOX4 by densitometry. The signal intensity for HO-1 or NOX4 at control was set to 1.0. (D) BEAS-2B cells were exposed to either CE or control for 4 hours, and HO activity was measured as pmol of bilirubin formed per mg protein per h. Data presents mean values of three independent experiments. Data are shown as a mean ± SD. ** p < 0.01 vs control by a one-way ANOVA with HSD test. |