
|
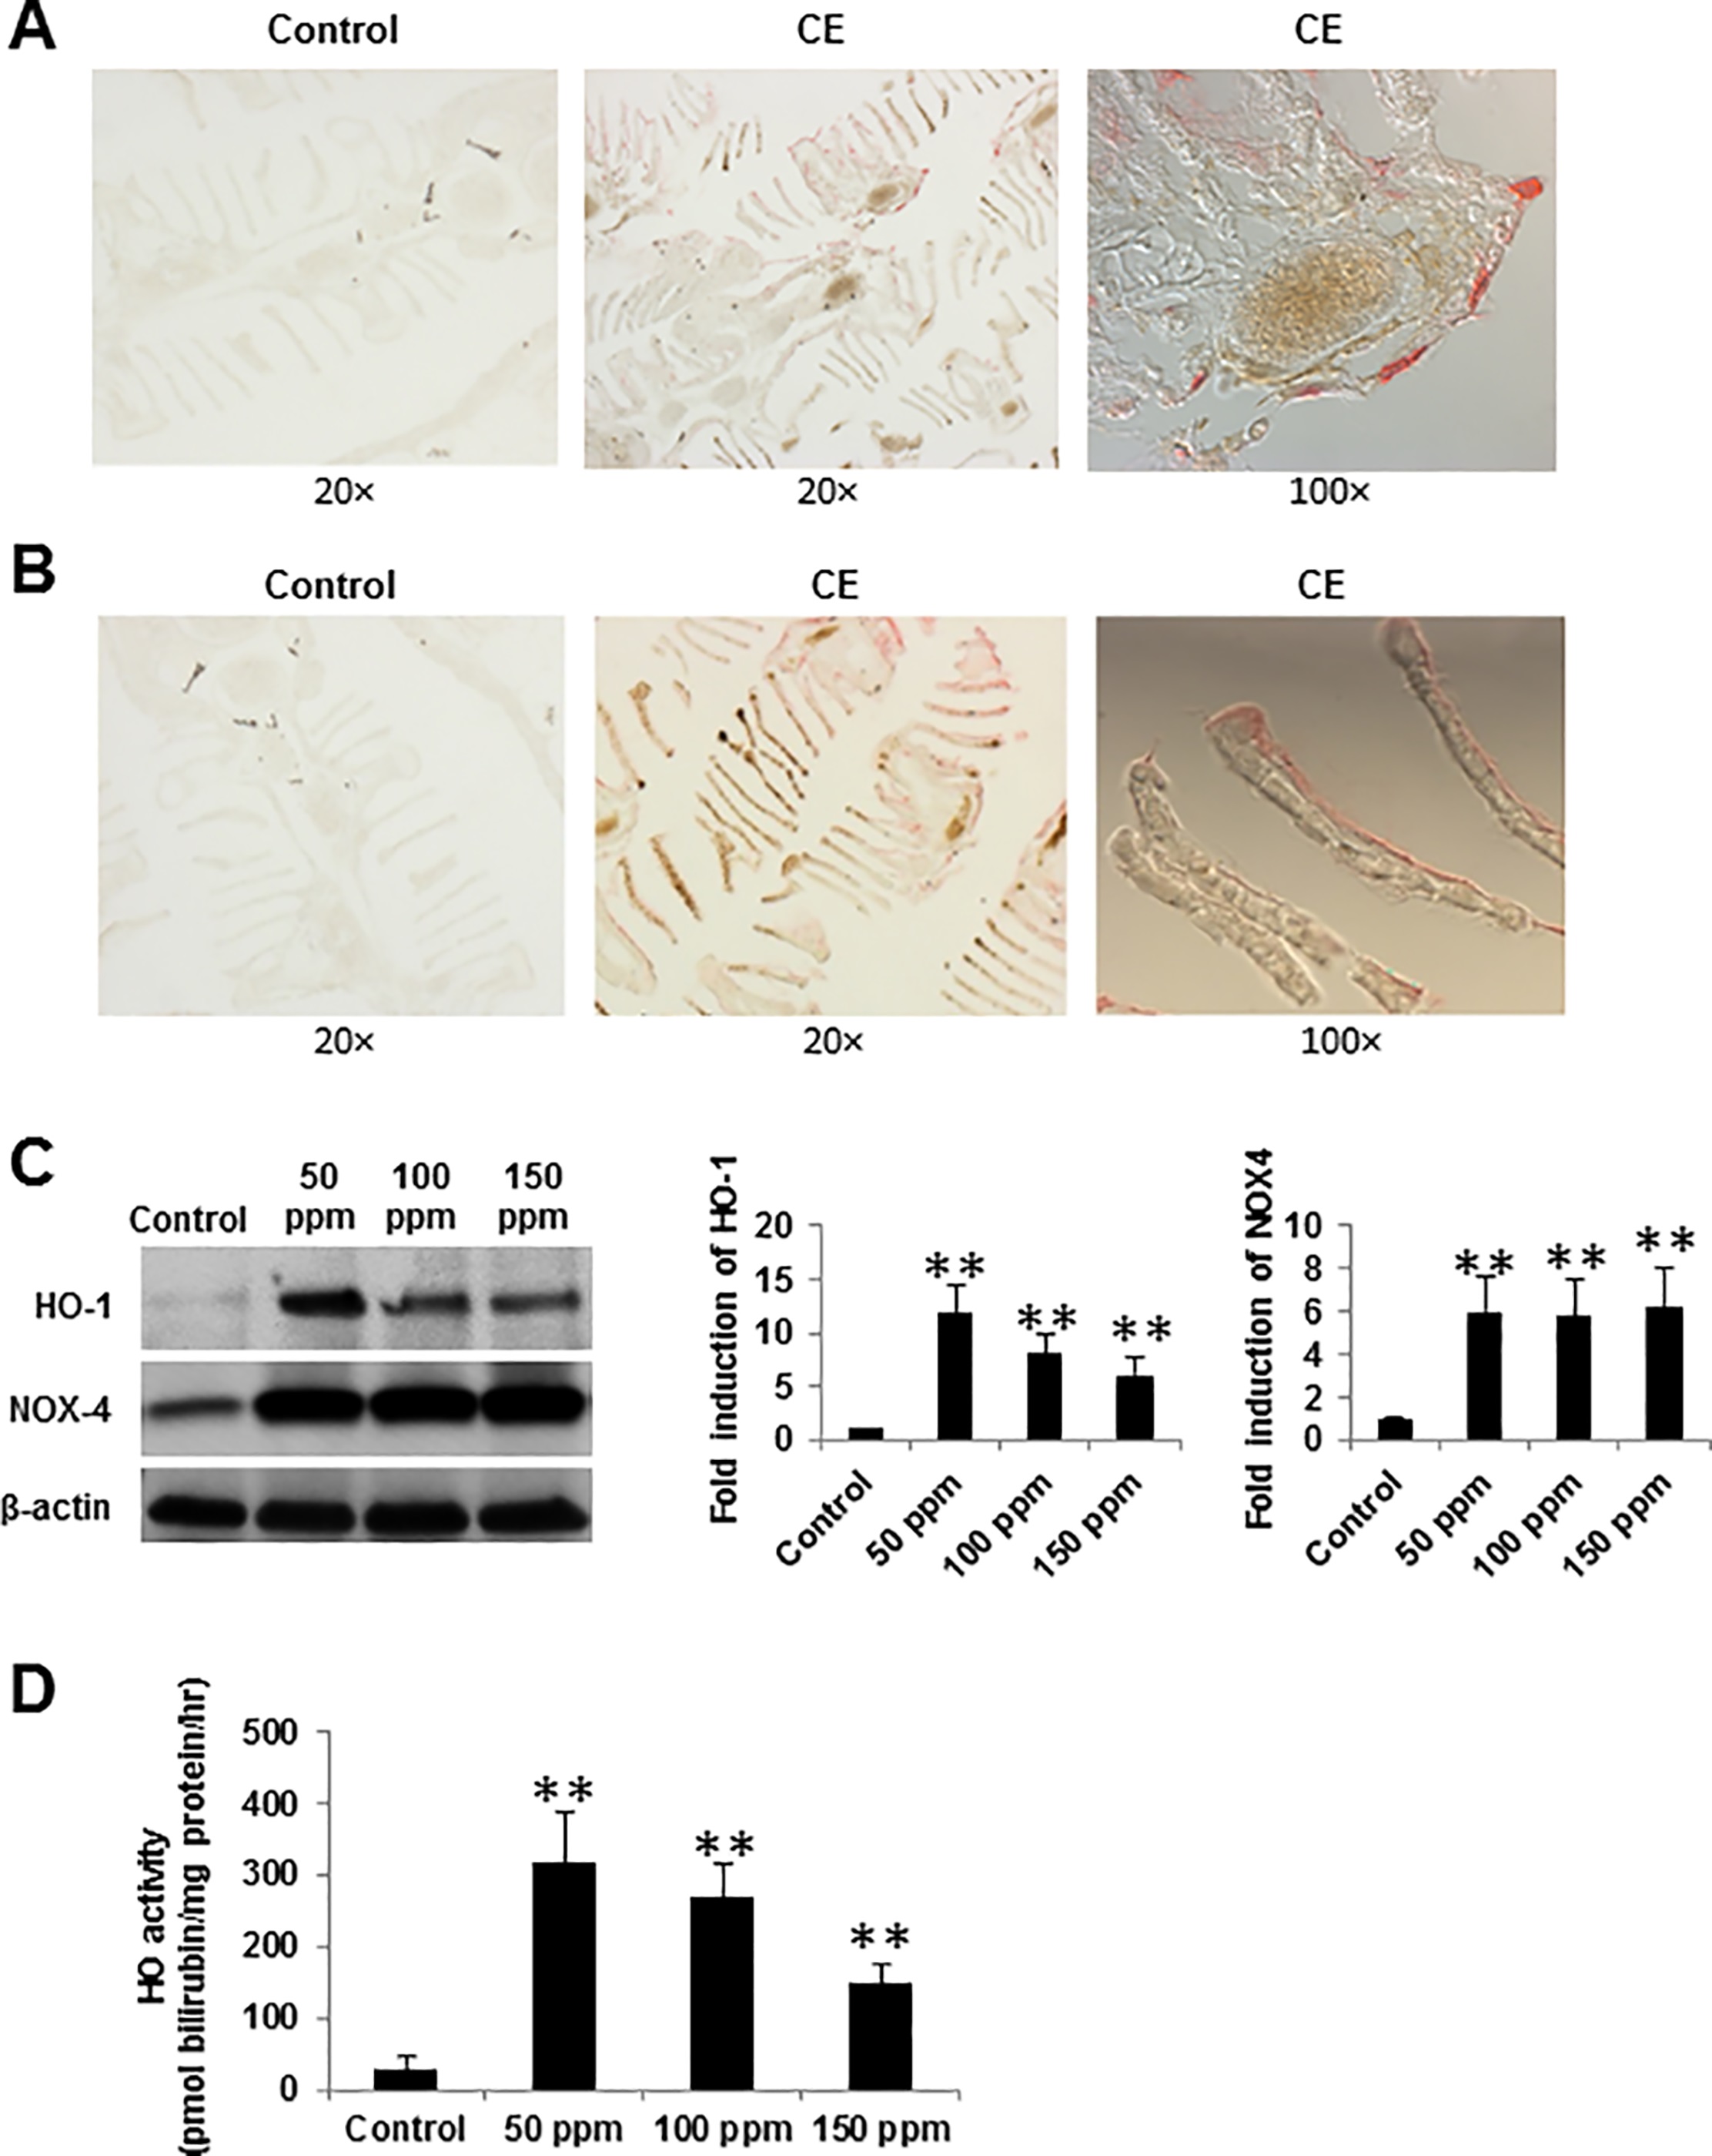
Fig. 5
Upregulation of HO-1 and NOX4 in response to CE stimulation.
Zebrafish were exposed to either CE 150 ppm or control for 56 hours and IHC analysis was performed for HO-1 (A) and NOX4 (B) expression. CE exposure is accomplished by holding adult zebrafish in 1 liter borosilicate class beakers (acid washed, followed with neutralizing alkali) to eliminate any potential reaction of the CE with plastic. (C) Cell lysates from BEAS-2B cells were analyzed by western blotting with anti-HO-1 and NOX4 antibodies at different concentrations of CE for 4 hours. β-actin was used as loading control. For quantification of the HO-1 and NOX4 expression, membranes were scanned and the bar graphs illustrated the relative expression of HO-1 and NOX4 by densitometry. The signal intensity for HO-1 or NOX4 at control was set to 1.0. (D) BEAS-2B cells were exposed to either CE or control for 4 hours, and HO activity was measured as pmol of bilirubin formed per mg protein per h. Data presents mean values of three independent experiments. Data are shown as a mean ± SD. ** p < 0.01 vs control by a one-way ANOVA with HSD test.