
- Title
-
An In Vivo Chemical Genetic Screen Identifies Phosphodiesterase 4 as a Pharmacological Target for Hedgehog Signaling Inhibition
- Authors
- Williams, C.H., Hempel, J.E., Hao, J., Frist, A.Y., Williams, M.M., Fleming, J.T., Sulikowski, G.A., Cooper, M.K., Chiang, C., Hong, C.C.
- Source
- Full text @ Cell Rep.
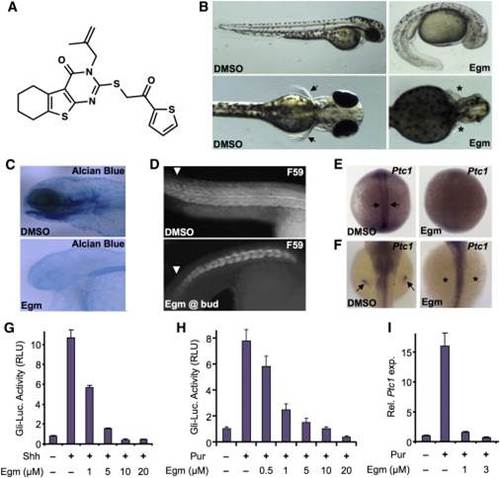
Eggmanone Affects Embryonic Zebrafish Patterning through Inhibition of Hedgehog Signaling (A) The chemical structure of eggmanone (Egm), (3-(2-methylallyl)-2-((2-oxo-2-(thiophen-2-yl)ethyl)thio)-5,6,7,8-tetrahydrobenzo[4,5]thieno[2,3-d]pyrimidine-4(3H)-one), is shown. (B) Zebrafish embryos treated with 2 µM Egm starting at 4 hr post fertilization (hrpf) exhibited a range of phenotypes found in Hh pathway mutants, including ventral tail curvature, loss of pectoral fins, and smaller eyes. (C) Alcian blue staining following 2 µM Egm treatment at 4 hrpf revealed altered craniofacial development, including the jaw. (D) Trunk slow muscles immunostained with anti-MyHC antibody (F59) showed altered slow-muscle formation upon Egm treatment (2 µM). (E) Egm treatment (1 µM) abolished Hh-responsive Ptc1 expression in adaxial cells at 12 hrpf (arrows). (F) Egm treatment (1 µM) ablated Hh-responsive Ptc1 expression in the pectoral fin bud at 48 hrpf (arrows and asterisks). (G) Egm inhibited Sonic hedgehog (Shh)-responsive Gli-luciferase (Gli-Luc) reporter activity in a dose-dependent manner when stimulated with Shh-conditioned medium (n = 4 for each condition, results represented as mean relative luciferase units (RLU) ± SEM; p value < 0.0184, starting at 1 µM). (H) Egm inhibited purmorphamine-induced (3 µM) Gli-Luc reporter activity in a dose-dependent manner (mean ± SEM, n = 4 for each condition; p value < 0.0054, starting at 0.5 µM). (I) Egm inhibited purmorphamine-induced (3 µM) Ptc1 expression in NIH 3T3 fibroblasts (mean ± SEM, n = 3, expression normalized to GAPDH; p value < 0.003, starting at 1 µM). Related to Figures S1 and S3. |
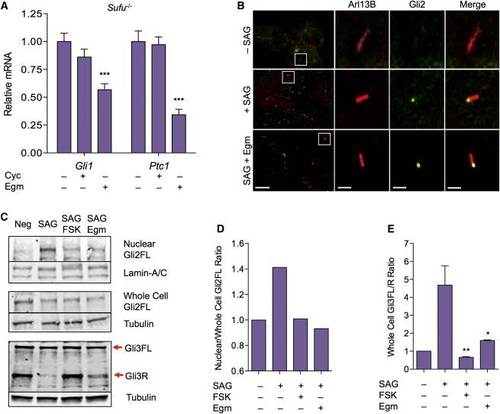
Eggmanone Alters the Activity of Gli Transcription Factors (A) Quantitation of mRNA transcripts of Gli1 and Ptc1 in Sufu-/- cells when treated with 10 µM Cyc (mean ± SEM, n = 7; not significant) or 10 µM Egm (mean ± SEM, n = 10; p = < 0.0001) is given, expression normalized to GAPDH. (B) Immunostaining for the cilium marker Arl13b (red) and Gli2 (green) of unstimulated MEFs (top), MEFs stimulated with SAG (20 nM) in the presence of DMSO control (middle), or 5 µM Egm (bottom). Co-localization of Gli2 (yellow) in the primary cilium remained unchanged in Egm-treated MEFs. Representative cilium (white box) is magnified to the right; scale bar (left column), 10 µm, (columns 2–4) 0.2 µm. (C) Representative western blot for full-length Gli2 in nuclear (top, n = 4) and whole-cell (middle, n = 2) fractions of NIH 3T3 cells, and western blot of Gli3 (bottom, n = 3) from whole-cell lysate of C3H10T1/2 cells. Corresponding western blots for nuclear Lamin-A/C and whole-cell α-tubulin as loading controls are shown. Neg, unstimulated; SAG, stimulated with SAG (100 nM) for 1.5 hr (Gli2) or 24 hr (Gli3); SAG + FSK, co-treated with SAG and FSK (30 µM); SAG + Egm, co-treated with SAG and Egm (10 µM); FL, full-length active forms of Gli2 and Gli3; R, repressor form of Gli3. (D) Quantitative analysis of the mean ratio of normalized nuclear full-length Gli2 to normalized whole-cell Gli2 from (C) is given. (E) Quantitative analysis of the ratio of full-length to repressor form of Gli3 from (C) is given (mean ± SEM, n = 3 for each condition; p = 0.0095, p = 0.028 versus SAG). Related to Figure S2. |