
- Title
-
A Novel Liposome-Based Nanocarrier Loaded with an LPS-dsRNA Cocktail for Fish Innate Immune System Stimulation
- Authors
- Ruyra, A., Cano-Sarabia, M., Mackenzie, S.A., Maspoch, D., and Roher, N.
- Source
- Full text @ PLoS One
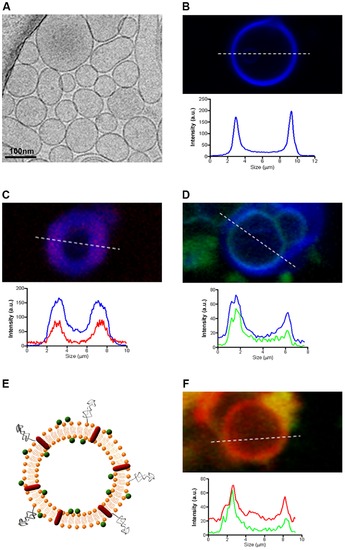
Characterization of liposomal formulations. (A) Representative Cryo-TEM image of DLPC/Chol/Cholesteryl/PEG600-Chol (563.56160.5) liposomes extruded through a 200 nm pore size membrane. (B) Confocal fluorescence image of a single liposome tagged on its lipid bilayer with Marina Blue-DHPE (blue) and its corresponding fluorescence intensity profile. (C) Confocal fluorescence image of a single Marina Blue-labeled liposome containing AlexaFluor594-labeled LPS (red) and their corresponding fluorescence intensity profiles. (D) Confocal fluorescence image of a single Marina Blue-labeled liposome containing fluorescein-labeled poly (I:C) and their corresponding fluorescence intensity profiles. (E) Schematic representation of the liposomal IS-cocktail (NLc) showing the presence of both encapsulated LPS (red) and poly (I:C) (green) in the lipidic bilayer of liposomes. (F) Confocal fluorescence image of a single liposome containing both fluorescein-labeled poly (I:C) (green) and AlexaFluor594-labeled LPS (red) and their corresponding fluorescence intensity profiles. |
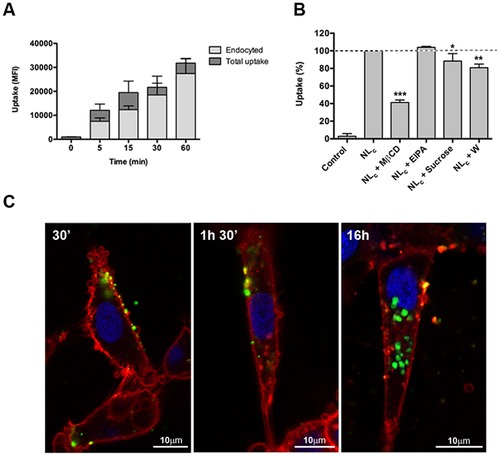
Endocytosis of NLc formulation by ZFL cells. (A) Flow cytometry time-course comparison of the membrane-bound (dark grey bar) versus the endocyted liposomes (light grey bar) after incubation with NLc (750 μg/ml liposome, 25 μg/ml poly (I:C) and 12.5 &mug/ml LPS) at the indicated times. Data represent means ± SD of three independent experiments. (B) Effect of chemical inhibitors on the endocytosis of the NLc (750 μg/ml liposome, 25 μg/ml poly (I:C) and 12.5 μg/ml LPS). Inhibitors were used at the following concentrations: MβCD at 5 mM, EIPA at 50 μM, sucrose at 300 mM and W at 100 nM. The uptake of cells without inhibitors (NLc bar) was used as 100% uptake control and non-treated cells were used as control (control bar). Data represent means ± SD of three independent experiments. Differences were analyzed using One-way ANOVA followed by Tukey′s post test. *, p<0.05; **, p<0.01; ***, p<0.001. (C) Confocal microscopy images of fluorescent liposomes (NLc) endocyted by ZFL cells. Cells were incubated for 30 min, 1.5 h and 16 h with NLc containing DHPE-Fluorescein (green) at a 0.05 molar ratio. Cell membranes were stained with CellMask (red) and the nucleus was stained with Hoechst (blue). |
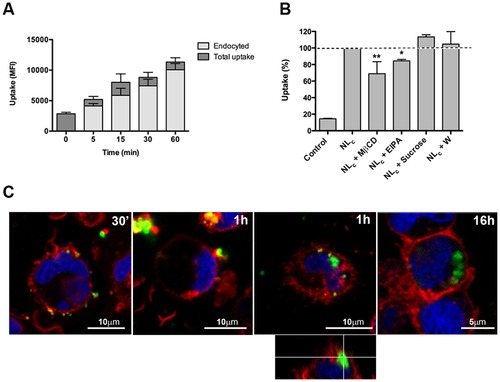
Endocytosis of NLc formulation by trout macrophages. (A) Flow cytometry time-course comparison of the membrane-bound (dark grey bar) versus the endocyted liposomes (light grey bar) after incubation with 750 μg/ml liposome-encapsulated 25 μg/ml poly (I:C) and 12.5 μg/ml LPS at the indicated times. Data represent means ± SD of three independent experiments. (B) Effect of chemical inhibitors on the endocytosis of NLc (750 μg/ml liposome-encapsulated 25 μg/ml poly (I:C) and 12.5 μg/ml LPS) macrophages uptake. Inhibitors were used at the following concentrations: MβCD at 5 mM, EIPA at 50 μM, sucrose at 150 mM and W at 100 nM. The uptake of cells not treated with inhibitors (NLc bar) was used as 100% uptake control and non-treated cells were used as control (control bar). Data represent means ± SD of 3 independent experiments. Differences were analyzed using One-way ANOVA followed by Newman-Keuls post-test. *, p<0.05; **, p<0.01. (C) Confocal microscopy images of fluorescent liposomes (NLc) endocyted by macrophages. Cells incubated 30 min, 1 h and 16 h with NLc containing DHPE-Fluorescein (green) at a 0.05 molar ratio. Cell membranes were stained with CellMask (red) and nucleus with Hoechst (blue). |