
- Title
-
Behavioral and synaptic circuit features in a zebrafish model of fragile X syndrome
- Authors
- Ng, M.C., Yang, Y.L., and Lu, K.T.
- Source
- Full text @ PLoS One
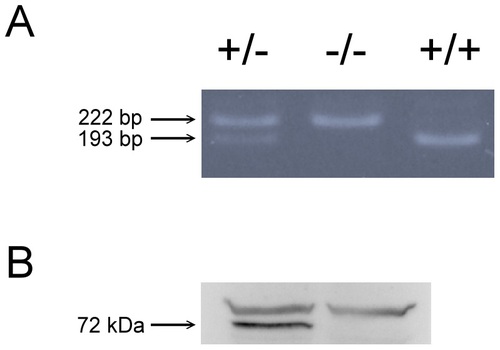
Summary of genotyping results. (A) Representative data obtained from genotyping of wild-type (+/+), heterozygous (+/-) and homozygous (-/-) fishes was validated by polymerase chain reaction. (B) Brain tissues were analyzed by western blot using an FMRP specific antibody. Lane 1 contains wild-type (WT) and Lane 2 contains fmr1-/- (KO). The arrow points at FMRP located. The FMRP protein is completely absent in fmr1-/-. EXPRESSION / LABELING:
|
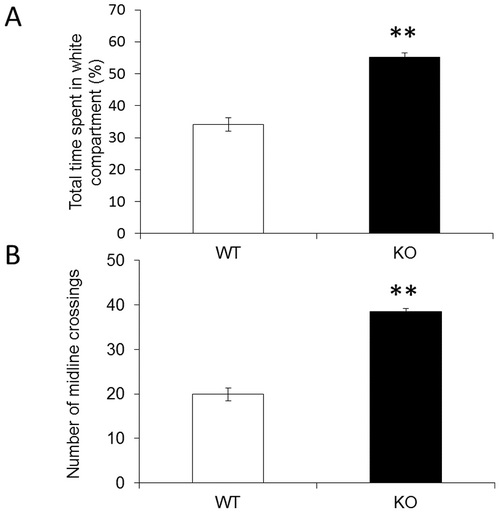
Anxiolytic-like responses of fmr1 KO zebrafish. (A) Bar graphs of the time spent in the white compartment by fmr1 KO and wild-type fish. **p<0.01 compared with wild-type fish. (B) Bar graph of the number of midline crossings for fmr1 KO (n = 12) and wild-type fish (n = 10). **p<0.01 compared with wild-type fish. PHENOTYPE:
|

The inhibitory avoidance of fmr1 KO and wild-type fish. Bars indicate the mean latencies ± the SEMs to cross from the shallow to the deep compartment (in seconds) in the training and test sessions for both genotypes. *p<0.05 compared with training sessions; #p<0.05 compared with wild-type fish. PHENOTYPE:
|

Locomotor activity of fmr1 KO and wild-type fish. Bar graphs of the total distance moved (in cm) and mean speeds (in m/sec) of fmr1 KO and wild-type fish. **p<0.001 compared with wild-type fish. PHENOTYPE:
|
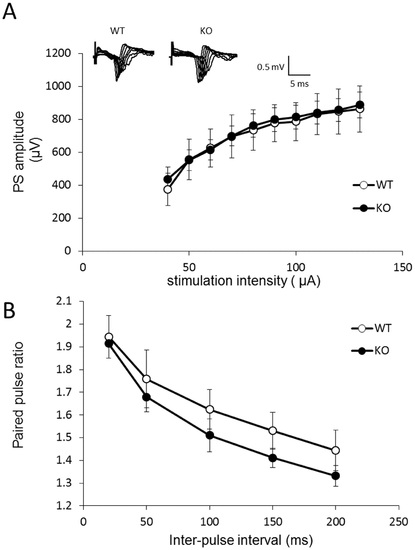
Basal synaptic function is not different between fmr1 KO and wild-type fish. (A) Summary of the input-output curves that were created by comparing PS amplitude and stimulus intensity (40-130 µA)(n = 6). (B) Paired-pulse facilitation (FFP) was measured by applying paired stimuli and quantifying the facilitation of the second potential relative to the first as a function of the inter-pulse interval (<200 ms)(n = 7). PHENOTYPE:
|
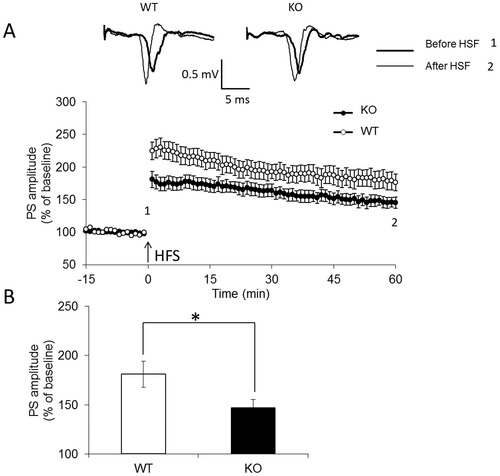
LTP was significantly reduced in fmr1 KO zebrafish. (A) The arrow indicates delivery of HFS. Insets are representative, superimposed, single sweeps before and after LTP induction in wild-type (n = 9) and fmr1 KO (n = 10) zebrafish. (B) Summary of the averaged magnitudes of LTP. Bars correspond to the percentages of baseline PS amplitudes during the last 10 min. *p<0.05 compared with wild-type. PHENOTYPE:
|