
- Title
-
Neutrophils exert protection in the early tuberculous granuloma by oxidative killing of mycobacteria phagocytosed from infected macrophages
- Authors
- Yang, C.T., Cambier, C.J., Davis, J.M., Hall, C.J., Crosier, P.S., and Ramakrishnan, L.
- Source
- Full text @ Cell Host Microbe

Zebrafish Neutrophils Are Marked by GFP Expression in the lyz-Green Line and Are Functionally Similar to Mammalian Neutrophils (A) Cartoon of the zebrafish at two developmental stages showing sites of primitive and definitive hematopoiesis (black arrows) and injection sites used in this study (red arrows). CHT, caudal hematopoietic tissue. (B) GFP-positive cells in lyz-green fish showing well-defined granules (black brackets). Scale bar, 10 μm. (C) Colocalization of GFP-expressing cells (black arrows) with Sudan black. Scale bar, 20 μm. (D) Individual fluorescence channels of a single image of the lyz-red mpx:gfp double transgenic larvae. Arrow identifies a cell with differential expression of the two transgenes. Scale bar, 20 μm. (E) DIC (top) and GFP fluorescence channel (bottom) of a single image of a lyz-green larva stained with neutral red. Macrophages, red arrows; neutrophil, green arrowhead; pigment cell, P. Scale bar, 20 μm. (F) Whole-mount in situ hybridization analysis of 48 hpf lyz-green larva with fms probe (red fluorescence) combined with GFP antibody staining (green fluorescence). Macrophages, yellow arrowheads; neutrophils, yellow arrows. Scale bar, 10 μm. (G–J) Median phagocyte recruitment into the ear (G) or hindbrain ventricle (H–J) of 48 hpf larvae in response to injection of vehicle (mock), IL-8, LTB4, or fMLP. In (I) and (J), fpr1 mo refers to larvae with morpholino knockdown of the formyl peptide receptor 1. Results in (G)–(J) are representative of two experiments. Significance testing performed by Kruskal-Wallis test with Dunn′s posttest in (G)–(J). *p < 0.05; **p < 0.01; ***p < 0.0001. |
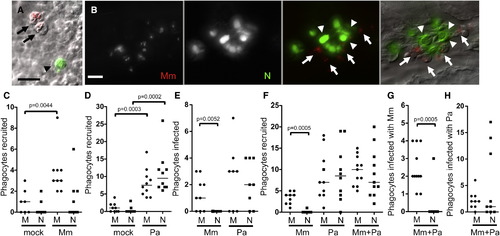
Neutrophils Are Poorly Recruited to the Initial Site of Mycobacterial Infection and Do Not Phagocytose Mycobacteria (A) Fluorescence and DIC overlay of macrophages infected with red fluorescent Mm (arrows) and a green fluorescent neutrophil (arrowhead) 10 min after caudal vein injection of 48 hpf larva. Scale bar, 10 μm. (B) Infected macrophages (arrows) and uninfected neutrophils (arrowheads) 24 hr after Mm injection into caudal vein of 48 hpf larva. Scale bar, 20 μm. (C–H) Median number of phagocytes recruited to, and infected in, the HBV of 48 hpf larvae 6 hr postinfection of vehicle (mock), (C) 108 Mm, (D) 45 Pa, (E) 108 Mm or 18 Pa, and (F–H) 27 Mm and 22 Pa together. M, macrophage, N, neutrophil. Results in (C)–(H) are each representative of more than three experiments. p value determined by Mann-Whitney rank test. (Also see Figure S1 and Movie S1.) |
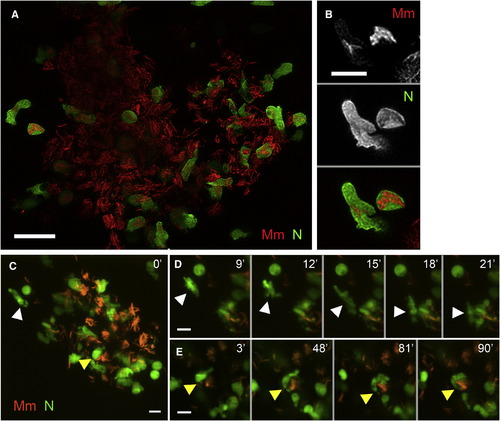
Neutrophils Are Present in the Early Granuloma (A) High-resolution laser-scanning confocal image showing a mycobacterial granuloma containing uninfected and infected neutrophils. Scale bar, 20 μm. (B) Two GFP-positive neutrophils infected with red fluorescent Mm from granuloma in (A). Scale bar, 10 μm. (C–E) Series of time-lapse spinning-disc confocal images highlighting cellular dynamics of neutrophils of the early granuloma. (C) A snapshot of a granuloma with the two neutrophils (arrowheads) monitored by time-lapse imaging. (D) Uninfected neutrophil (white arrowhead) arriving at the granuloma shown in (C). (E) Uninfected neutrophil (yellow arrowheads) engulfing infected macrophage to become infected. Elapsed minutes indicated in upper right corner of (D) and (E). Green, neutrophil (N); red, Mm. Scale bars in (C)–(E), 15 μm. (Also see Movie S2, Movie S3, and Movie S4.) |

Neutrophils Play a Protective Role upon Granuloma Formation (A and B) Fluorescence and DIC overlay of 3 dpf WT (A) and WHIM (B) zebrafish showing neutrophil distribution. Arrows, yolk; white arrowheads, pronephros; black arrowheads, CHT. Scale bar, 300 μm. (C and D) High-resolution laser confocal images of representative 3 dpi granulomas in WT (C) and WHIM (D) larvae. Green, neutrophil (N), red, Mm. Scale bar, 30 μm. (E) Median infected neutrophils per granuloma, normalized to granuloma size. Granulomas were from ten WT and seven WHIM larvae. p value by Mann-Whitney rank test. (F) Mean size of granulomas in (E). p values were determined by Student′s unpaired t test. (G) Serial bacterial burdens (mean ± SEM) of 2 dpf WT (n = 13) or WHIM (n = 10) fish infected by caudal vein with 189 Mm measured by fluorescent pixel count (FPC). Representative of three experiments. *p < 0.05; **p < 0.01 (one-way ANOVA with Bonferroni′s multiple comparison test; all other comparisons not significant). Also see Figure S3. EXPRESSION / LABELING:
PHENOTYPE:
|

Neutrophils Phagocytose and Kill Mycobacteria from Infected Granuloma Macrophages (A–C) Mean speed (A), sphericity (B), and bacterial volume (C) of infected neutrophils in 3 dpi granulomas, sampled from three granulomas each from different larvae. p value by Student′s unpaired t test (B) and by Student′s unpaired t test with Welch′s correction (A and C). (D) Representative frames of time-lapse laser confocal images of infected motile neutrophils in larva showing a neutrophil (white arrowhead) phagocytosing bacteria from a granuloma macrophage. (E) Bacterial burden over time and interval speed of neutrophil in (D). (F) Representative frames of time-lapse laser confocal images of infected motile neutrophil in larva showing neutrophil (white arrowhead) repeatedly phagocytosing bacteria (yellow and blue arrows) from a granuloma macrophage. (G) Bacterial burden over time and interval speed of neutrophil in (F) with yellow and blue arrowheads indicating respective phagocytic events in (F). In (D) and (F), green, neutrophil (N); red, Mm, minutes in upper right corner. Yellow objects (white arrowheads) showing bacteria within neutrophils are built by 3D surface rendering with Imaris. Also see Figure S4 and Movie S5, Movie S6, and Movie S7. |
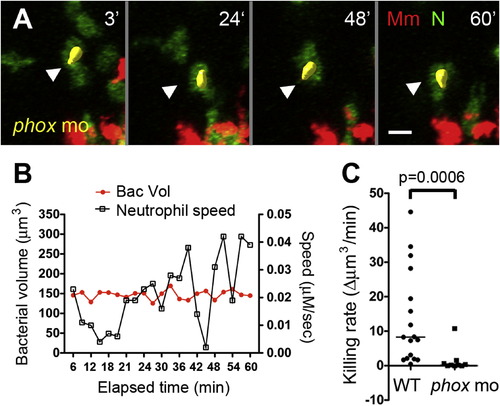
Neutrophil Killing of Intracellular Mycobacteria Is Mediated by NADPH Oxidase (A) Representative frames of time-lapse laser confocal images of a motile infected neutrophil (white arrowhead) in phox morphants (phox mo). Green, neutrophil (N); red, Mm. Elapsed minutes in upper right corner. (B) Bacterial burden over time and interval speed of neutrophil in (A). (C) Median killing rate (decrease in bacterial volume of infected neutrophil over time) of WT and phox morphant neutrophils. Infected neutrophils were sampled from three granulomas in three different infected larvae for each group. p values by Mann-Whitney rank test. Also see Figure S5. |

(Related to Figure 2) Mycobacteria are poorly phagocytosed by neutrophils at the initial infection site at late developmental stages or in the presence of serum (A) Fluorescence and DIC overlay of red M. marinum (Mm) (arrows) and green neutrophils (N) (arrowhead) in 5 dpf larva 24 hours after caudal vein injection. Scale bar, 10 μm. (B and C) Median phagocyte recruitment and bacterial phagocytosis six hours after HBV co-injection of 80-120 M. marinum and 30-40 P. aeruginosa, both incubated with fetal bovine serum (FBS) or heat-inactivated (HI) FBS. (D and E) Median phagocyte recruitment and bacterial phagocytosis phagocytosis six hours after HBV co-injection of 90 M. marinum, and 30-40 P. aeruginosa incubated with adult fish serum (AFS) or phosphate buffered saline (PBS). M, macrophage; N, neutrophil. p values by Mann- Whitney rank test. |