
- Title
-
Visual Input Modulates Audiomotor Function via Hypothalamic Dopaminergic Neurons through a Cooperative Mechanism
- Authors
- Mu, Y., Li, X.Q., Zhang, B., and Du, J.L.
- Source
- Full text @ Neuron
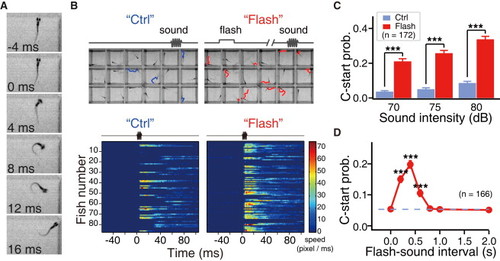
Preceding Visual Stimulus Enhances Sound-Evoked C-Start Behavior of Larval Zebrafish (A) Representative images showing a successful C-start escape behavior of a 5 dpf zebrafish larva in response to a sound stimulus (80 dB), which was applied at 0 ms. (B) Examples showing sound-evoked C-start behavior of same larvae under control condition (“Ctrl”) or when a preceding white flash (15 ms, 10 lux) was applied at 0.4 s before the sound onset (“Flash”). Sound stimulus: 500 Hz 10 ms pure tone at 80 dB. Top, a part of portraits of 96-well plate with one 5-dpf larva in each well. The blue and red traces represent the 60 ms trajectory (immediately after the sound onset) of the head in all larvae exhibiting C-start behavior in response to the sound. Bottom, heat map showing the time course of locomotion speed of all 87 larvae from the same 96-well plate under Ctrl (left) or Flash (right) condition. The locomotion speed is color-coded. (C) Summary of data showing that a preceding flash applied at 0.4 s before the sound onset increases the probability of C-start behavior evoked by sound stimuli at different intensities. Data were obtained from 172 larvae at age 5–6 dpf. (D) Time window showing that flashes applied 0.2–0.6 s before the sound (70 dB) are effective in enhancing auditory C-start behavior. The dashed line indicates the C-start probability under control condition. The data were obtained from 166 larvae aged at 5 dpf with each tested at each flash-sound interval. ***p < 0.001 (paired Student’s t test). Error bars represent SEM. See also Figure S1. |

Dopaminergic Neurons in the Caudal Hypothalamus Are Required for the Visual Modulation of Audiomotor Functions (A) Effects of two-photon laser focal lesion of specific dopaminergic neuron clusters on preceding flash-induced increases in the probability of sound-evoked C-start behavior. The open and filled bars represent data obtained from larvae without or with laser lesion, respectively. The numbers on the bars represent the numbers of ETvmat2:GFP larvae examined. (B and C) Examples (B) and summary (C) of data showing that morpholino oligo (MO)-based knockdown of th2 (th2-MO) or both otp a and otp b (otp-MO) reduces the number of DA-immunoreactive (DA-ir) neurons in the HC. Top in (B), DA-ir signal; Bottom in (B), merged DA-ir and GFP-ir signals. The blue dashed circles represent HC position. The images in (B) were taken from one optic section with a thickness of <4 μm. Scale represents 10 μm. (D) Effects of th2 knockdown and otp a and otp b co-knockdown on preceding flash-induced increases in the probability of sound-evoked C-start behavior. (E) Summary of data showing the effects of focal HC lesion, th2 knockdown, and otp a and otp b co-knockdown on preceding flash-induced enhancement of Mauthner cell a-CSCs. n.s., no significance; p < 0.05; **p < 0.01; p < 0.001 (paired Student’s t test for M-cell recording data and unpaired Student’s t test for behavior data). Error bars indicate SEM. See also Figures S5 and S6. EXPRESSION / LABELING:
|
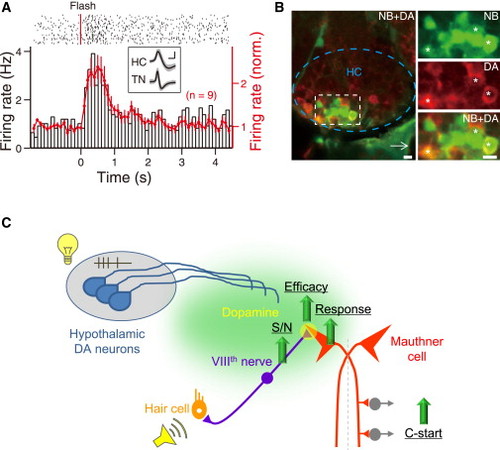
Dopaminergic Neurons in the Caudal Hypothalamus Exhibit Bursting Activity in Response to Flash Stimulus and Send Projections Nearby the VIIIth Nerve-Mauthner Cell Circuit (A) Example (top; left y axis in bottom, black open bars) and summary (right y axis in bottom, red line) of data showing the spiking activity of HC neurons in response to a 15 ms flash (red line, top). Top, raster plot of a sample recording. Bottom: PSTH of the raster plot (left y axis) and summary of data obtained from 9 larvae (right y axis). Inset, sample (gray) and average (black) waveforms of action potentials from a HC neuron (“HC”) and an optic tectum neuron (“TN”). (B) Neurobiotin-based retrograde tracing of HC dopaminergic neurons. The area of the white square in (left) is enlarged in (right). The dashed blue line and white arrow in (left) mark the location of HC and the tip of notochord, respectively. Top right, NB-ir signal (green). Middle right, DA-ir signal (red). Bottom right, merged signals. The stars indicate double positive HC cells. The images were taken from one optic section with a thickness of <4 μm. Scale represents 0.5 mV, 1 ms in the inset of (A), 5 ¼m in (B). (C) Proposed model for the visual modulation of audiomotor function. A preceding flash induces bursting activities in hypothalamic dopaminergic neurons, which may release dopamine in the vicinity of VIIIth nerves-Mauthner cell circuits. Through D1R activation, the S/N ratio of VIIIth nerve spiking activity is elevated by reducing spontaneous activities, and the efficacy of VIIIth nerve-Mauthner cell synapses is increased, leading to an increase in sound-evoked responses of Mauthner cells and enhancement of auditory C-start escape behavior. See also Figure S7. |
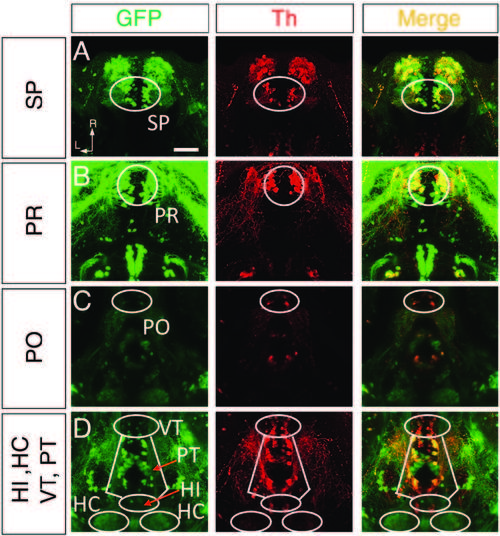
related to Figure 7. Tyrosine Hydroxylase (Th)-Immunostaining of ETvmat2:GFP Larvae (A-D) Projected confocal images showing GFP-immunoreactivity (GFP-ir,left), Th-immunoreactivity (Th-ir, middle) and merged (right) signals in the subpallium (SP), pretectum (PR), preoptic area (PO), ventral thalamus (VT), posterior tubercular (PT),intermediate hypothalamus (HI) and caudal hypothalamus (HC). Each cluster is delineated by white lines. The images were obtained from the same larva aged at 4 dpf. The z-stack movies are shown in Movies S4-S5. Dorsal view, rostral is up. L, lateral; R, rostral. Scale: 50 μm. EXPRESSION / LABELING:
|
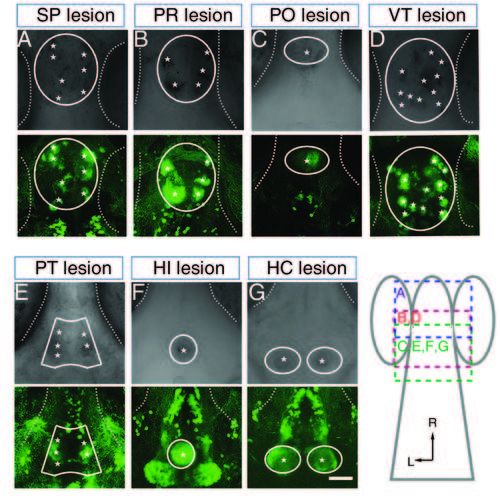
related to Figure 7. Two-Photon Laser Focal Scanning Effectively Ablates GFP-Positive Cells in ETvmat2:GFP Larvae (A-G) Brightfield images (top) and GFP-ir signals (bottom) in the subpallium (SP, A), pretectum (PR, B), preoptic area (PO, C), ventral thalamus (VT, D), posterior tubercular (PT, E), intermediate hypothalamus (HI, F) and caudal hypothalamus (HC, G) after two-photon laser-induced focal lesion of the corresponding clusters (white lines). The asterisks mark bulb-like structures, which indicate a successful cell lesion. The dotted lines delineate the position of the eye. Each larva was subjected to laser lesion of only one cluster of neurons. The lesion was performed on ETvmat2:GFP larvae aged at 4 - 5 dpf. The schematic in the bottom-right shows the brain regions, from which images in (A-G) were taken. Dorsal view, rostral is up. L, lateral; R, rostral. Scale: 50 μm. EXPRESSION / LABELING:
|