
- Title
-
Zebrafish glafenine-intestinal injury is ameliorated by mu-opioid signaling via enhancement of Atf6-dependent cellular stress responses
- Authors
- Goldsmith, J.R., Cocchiaro, J.L., Rawls, J.F., and Jobin, C.
- Source
- Full text @ Dis. Model. Mech.
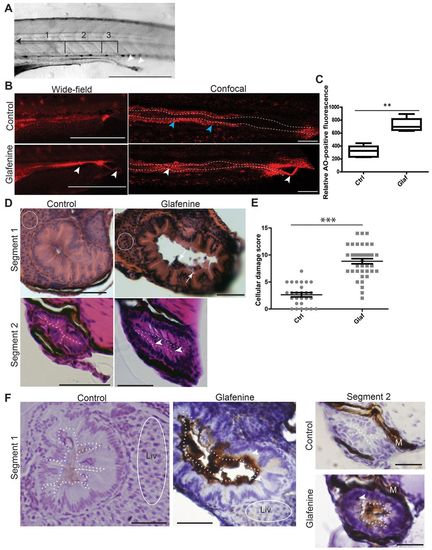
Glafenine results in apoptotic cell death with sloughing and dysmorphic cellular architecture. (A-F) All studies were made after 12 hours of glafenine exposure in 5 dpf zebrafish. (A) Lumenal sloughing is apparent on brightfield microscopy. Segments 1-3 of the intestine are bracketed and labeled. Arrowheads show sloughing from the intestine. Scale bar: 1 mm. (B) AO staining shows apoptotic lumenal and sloughing debris. Blue arrowheads point to enterocytes that autofluoresce red; white arrowheads point to apoptotic lumenal and extruded debris. Scale bars: 1 mm for wide-field images, 50 μm for confocal images. (C) Apoptotic mass can be detected by differences in relative AO fluorescence. Representative of four independent experiments, n≥4 per experiment. (D) H&E sections showing glafenine-induced injury. Regions of liver are encircled with white dashes (segment 1). The apical surface of the intestinal epithelium is outlined in white (segment 2). Arrows point to sloughed cellular debris and arrowheads point to nuclei. Scale bars: 50 μm. (E) Segment 2 histological scores, pooled from three independent experiments; n for each group is indicated on the graph. (F) Activated caspase-3 immunohistochemistry. The apical surface of the intestinal epithelium is outlined in white dots. Regions of liver are encircled by a solid white line. Arrowheads point to positively staining IECs; M, melanocytes; Liv, liver. Scale bars: 50 μm for segment 1, 12.5 μm for segment 2. **P<0.01, ***P<0.001. |
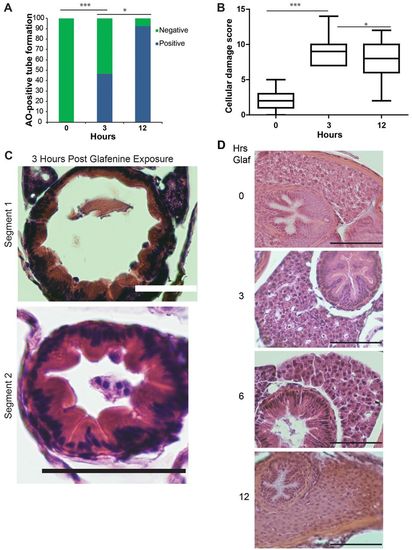
Progressive glafenine-induced injury over 0–12 hours is centered on the intestine. (A) AO-positive tube formation, n=13. (B) Segment 2 histological score, n≥9. The 0 and 12-hour time points are recapitulated from Fig. 1. (C) Histology at 3 hours. (D) H&E sections of livers of zebrafish exposed to 0, 3, 6 and 12 hours of glafenine. Mild hydropic changes are seen at 6 hours. Scale bars: 50 μm. *P<0.05, ***P<0.001. |

TEM identifies the apoptotic cells as intestinal epithelial in origin. (A–C) TEM images, representative of two separate fish, across multiple sections after 12 hours of glafenine exposure. 5000× magnification; scale bars: 2 μm. (A,B) Samples fixed after 12 hours of exposure. (C) Images taken after 3 hours of exposure to glafenine. (A) Ultrastructure architecture of control and glafenine-injured fish in segments 1 and 2 of the intestinal epithelium. Apoptotic IECs (white arrow in segment 1) and lumenal cellular debris (white arrows in segment 2) can be observed. Brush border is indicated by black arrows. (B) Lumenal debris seen with glafenine-induced injury in segment 1, which is consistent with microvesiculation of intestinal brush border. (C) ER stress in segment 2, with characteristic pitting marked by black arrowheads. |

Glafenine leads to ER stress and arrested cell stress responses. (A,B) Zebrafish larvae at 5.5–6 dpf were exposed to glafenine for the indicated times. Black arrows point to ER stress evidenced by pitting. Dashed circles outline stressed organelles being enveloped by membrane. Solid circles outline dead organelles. White arrowheads point to basement membrane invagination; white arrowhead with dashed line points to stressed mitochondria. Scale bars: 1 μm. (A) Lower magnification images. (B) Higher magnification images. |

Intestinal epithelial barrier leakage does not occur with acute glafenine treatment. (A,B) Zebrafish larvae at 6 dpf were pretreated with glafenine or vehicle control for 1 or 3 hours, followed by gavage with 1% TxR-dextran or 1% TxR-dextran plus 20 mM EDTA (positive control). ImageJ was used to quantitate the relative mean fluorescence in an ROI in the zebrafish larvae trunk above segments 2 and 3 of the intestine (white dashed rectangles). Values were normalized to an ROI outside of the fish as an internal control to account for background glare. (A) Dextran leaks into circulation and intersomitic spaces when co-gavaged with EDTA. Representative images of larvae from the 1-hour pretreatment group are shown. In larvae gavaged with dextran only, the dextran remains in the intestinal lumen. When co-gavaged with dextran plus EDTA, fluorescent signal is observed in circulation (dorsal aorta, white arrow) and intersomitic vessels and spaces (white arrowheads). BF, brightfield. Scale bars: 200 μm. (B) Treatment with glafenine does not lead to acute intestinal barrier disruption. Mean normalized fluorescence in the trunk was determined following 1 or 3 hours of pretreatment with glafenine or control. Graph represents data averaged from two experimental replicates taking into account the mean, s.d. and n (16–19 larvae/condition/experiment). Two-way ANOVA with Bonferroni post-test was performed to compare each column to all other columns. *P<0.05, **P<0.01. |

TEM studies show that glafenine-induced injury keeps the skin and musculature intact. TEM images, representative of three separate fish, after 12 hours of glafenine exposure. 2500× magnification. Scale bars: 2 μm. |
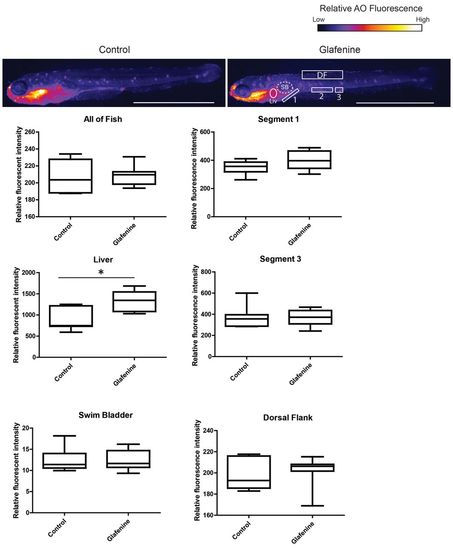
Glafenine-induced injury is specific to the gastrointestinal system. AO staining marks apoptotic cells throughout the fish. Studies were performed after 12 hours of glafenine exposure. Representative control and glafenine-treated fish are shown, with the regions analyzed shown on the glafenine image. Values are representative of three independent experiments, n≥4 fish/experiment/condition; *P<0.05. SB, swim bladder; Liv, liver; DF, dorsal fin. Scale bars: 1 mm. |
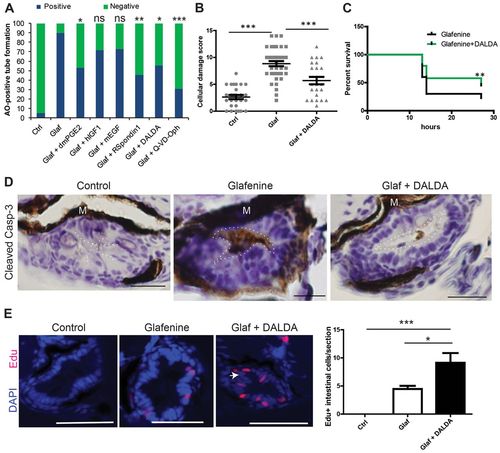
Glafenine-induced injury can be prevented with a subset of anti-apoptotic and/or pro-survival drugs, including the MOR agonist DALDA. (A-E) All studies performed after 12 hours of drug(s) exposure. (A) Rapid apoptosis assays show that glafenine-induced injury can be prevented by drugs that engage pro-survival and/or anti-apoptotic signaling, but not solely proliferative signalling; n≥15 per group. Control, glafenine and glafenine + DALDA results are all representative of three or more independent experiments; dmPGE2 results are representative of two independent experiments; other drugs results are representative of replicate experiments performed on the same day with different groups of larvae. Significance shown is relative to glafenine treatment alone; P<0.001 between control and glafenine groups (not shown on graph); n for each group is represented on the graph. Dosages: 10 μM dmPGE2, 250 ng/ml hIGF1, 10 nM mEGF and R-spondin, 50 μM Q-VD-Oph. (B) Segment 2 histological scores. Control and glafenine groups are recapitulated from Fig. 1, for ease of comparison with DALDA treatment. (C) DALDA enhances zebrafish survival from glafenine-induced injury. n=50, pooled from three independent experiments. Glafenine was used at 50 μM final concentration. (D) Activated caspase-3 immunohistochemistry staining in the intestinal epithelium. Representative of four fish per group. The lumenal edge is outlined in white; M, melanocytes. Scale bars: 12.5 μm. (E) Proliferation in segment 2 in response to drug treatment. White arrow shows hyperplastic cells seen with DALDA administration. Scale bars: 50 μm. Graph shows EdU staining of zebrafish with 12 hours of drug exposure for each group. n≥8, except for control group, where n=4; *P<0.05, **P<0.01, ***P<0.001. |
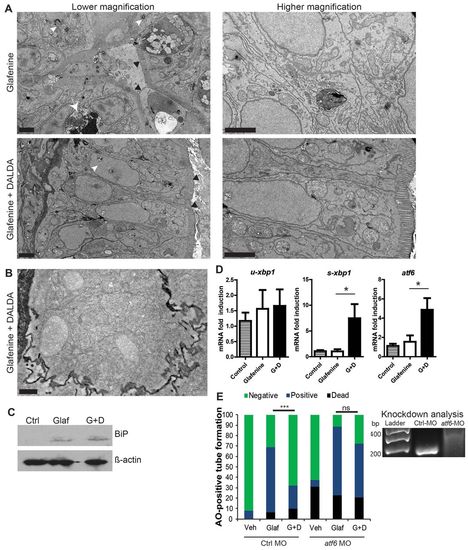
DALDA reverses glafenine-induced organelle stress and restores proper UPR responses. (A-E) All zebrafish studies were performed after of 12 hours glafenine exposure. (A) TEM with and without DALDA treatment demonstrates a lack of ER and organelle stress and resolved UPR. White arrowheads show pitting from ER stress. White arrow demarks apoptotic IEC. Black arrowheads indicate the brush border. Scale bars: 2 μm. (B) Same conditions as for A, showing granularity in the cytoplasm of segment 1 IECs, indicative of rough ER. Scale bar: 0.5 μm. (C) Glafenine-induced injury causes BiP protein accumulation, an early signal in the UPR cascade. Western blot representative of four independent experiments, each consisting of protein lysate from e10 pooled fish per condition. β-actin was used as loading control. (D) Real-time PCR for UPR genes: u-xbp1 (unspliced), s-xbp1 (spliced) and atf6. Each replicate for each condition was generated from 10 pooled micro-dissected fish gastrointestinal tracts, n≥4/group. (E) Fish were injected with 5 pmol of control or atf6 MO in 4.6 nl of water and subjected to the AO tube assay. Values were pooled from two independent experiments, n≥29/group. veh, vehicle-only group; glaf, glafenine-treated group; G+D, group treated with glafenine plus DALDA. Right: RT-PCR for atf6 in morpholino-injected fish, at 6 dpf. Wild-type band is at 180 bp, the morphant with an intron-1 inclusion is at 314 bp. Representative of triplicate groups of two independent experiments. *P<0.05, ***P<0.001. |
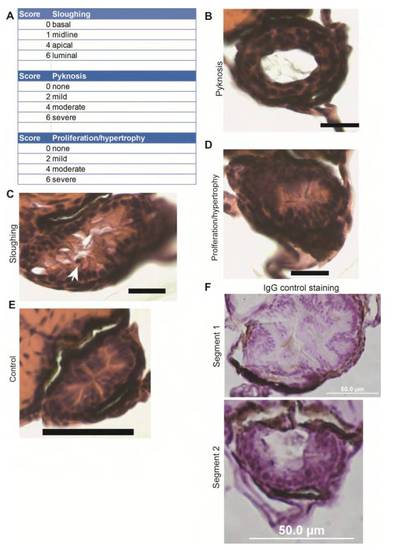
Details of the segment 2 histological scoring system. (A) Histological criteria used in the intestinal damage assessment. (B-F) Scale bars: 50 μm. (B) Example of pyknotic nuclei. Pyknosis score of 6, total score of 10. (C) Example of sloughing, arrow points to an apical nucleus. Sloughing score of 4, total score of 10. (D) Example of proliferation/ hypertrophy. Proliferation score of 4, total score of 12. (E) Control fish, total score of 1. (F) IgG (rabbit) control IHC for Caspase-3 studies, which show that the Caspase-3 staining observed is enterocyte and lumenal debris-specific. |

Glafenine-treatment does not result in gross intestinal bleeding. Double-reporter Tg(gata1:dsRed) sd2;(kdr1:EGFP)s843 zebrafish track both blood cells (red channel) and vasculature (green channel). Images representative of 5 individual fish, taken after 12 hours glafenine exposure. Scale bars: 1mm. (A) The zebrafish show no gross bleeding into the intestinal lumen. (B) The zebrafish show no gross vascular defects. |

Tg(NFkB:EGFP) fish show increased segment 2 NF-κB activation in zebrafish after injury with glafenine. Tg(NFkB:EGFP)nc1 reporter zebrafish were used to assess NF-κB activation after 12 hours of glafenine exposure. Representative of three independent experiments, n as portrayed. Scale bar: 1 mm. The same regions as in Fig. 7 were used, as marked on the fish. SB, swim bladder; Liv, liver; DF, dorsal fin. |