
|
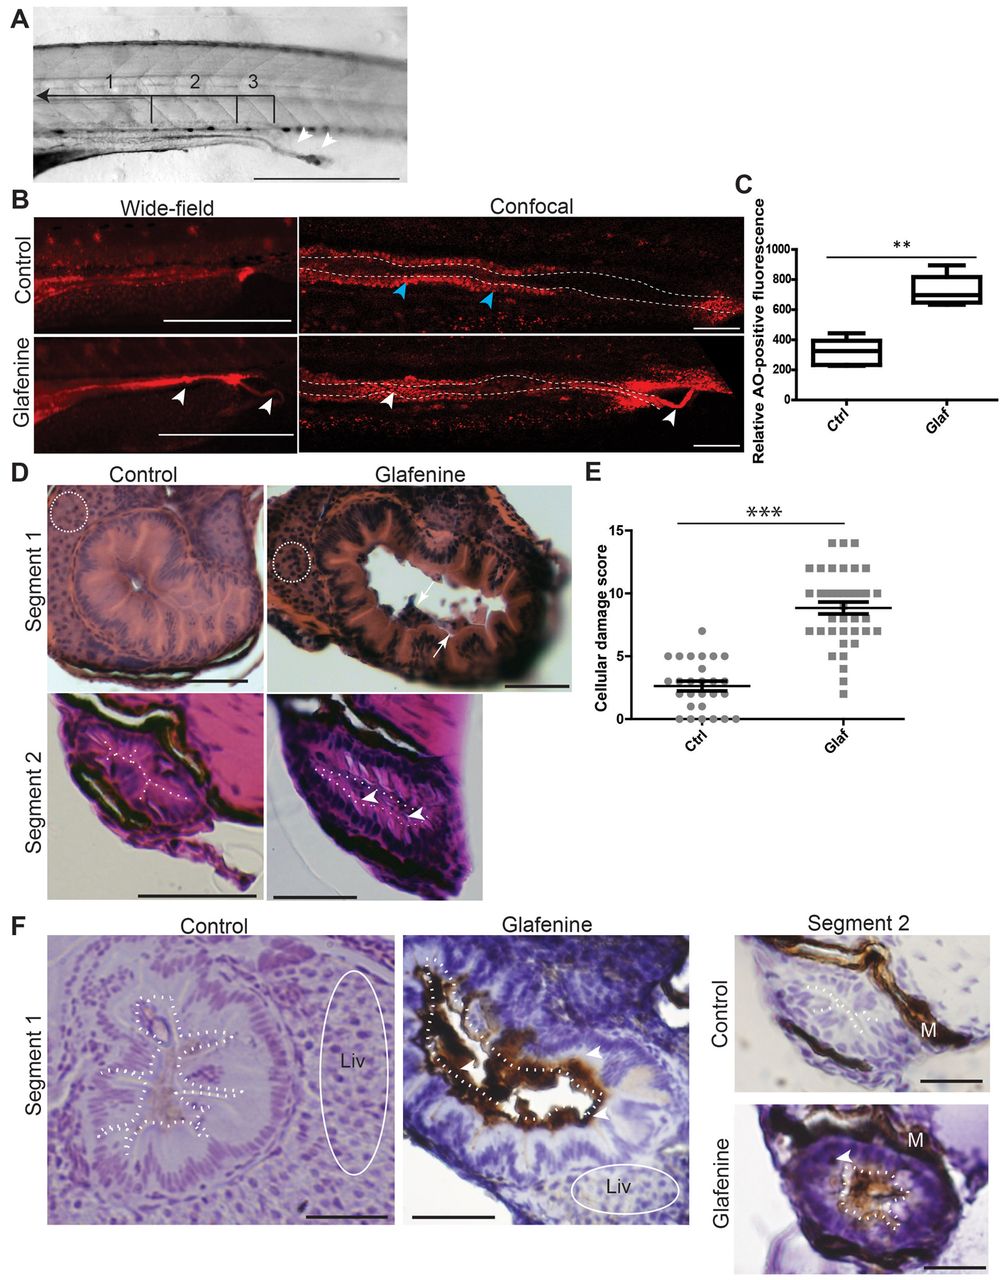
Fig. 1 Glafenine results in apoptotic cell death with sloughing and dysmorphic cellular architecture. (A-F) All studies were made after 12 hours of glafenine exposure in 5 dpf zebrafish. (A) Lumenal sloughing is apparent on brightfield microscopy. Segments 1-3 of the intestine are bracketed and labeled. Arrowheads show sloughing from the intestine. Scale bar: 1 mm. (B) AO staining shows apoptotic lumenal and sloughing debris. Blue arrowheads point to enterocytes that autofluoresce red; white arrowheads point to apoptotic lumenal and extruded debris. Scale bars: 1 mm for wide-field images, 50 μm for confocal images. (C) Apoptotic mass can be detected by differences in relative AO fluorescence. Representative of four independent experiments, n≥4 per experiment. (D) H&E sections showing glafenine-induced injury. Regions of liver are encircled with white dashes (segment 1). The apical surface of the intestinal epithelium is outlined in white (segment 2). Arrows point to sloughed cellular debris and arrowheads point to nuclei. Scale bars: 50 μm. (E) Segment 2 histological scores, pooled from three independent experiments; n for each group is indicated on the graph. (F) Activated caspase-3 immunohistochemistry. The apical surface of the intestinal epithelium is outlined in white dots. Regions of liver are encircled by a solid white line. Arrowheads point to positively staining IECs; M, melanocytes; Liv, liver. Scale bars: 50 μm for segment 1, 12.5 μm for segment 2. **P<0.01, ***P<0.001.