
- Title
-
The response of HMGA1 to changes in oxygen availability is evolutionarily conserved
- Authors
- Moussavi Nik, S.H., Newman, M., and Lardelli, M.
- Source
- Full text @ Exp. Cell Res.

A) RT-PCR of hmga1 at different developmental stages. B) Whole mount in situ analysis of hmga1 transcription during embryogenesis. Maternally-contributed transcripts of hmga1 can be detected in early cleavage embryos (A, 8-cell stage). At 40% epiboly stage, (B, and enlargement of margin in C) transcripts are observed in deep cells (dc) but not in the enveloping cell layer (e). A similar pattern of expression is observed at 75% epiboly (D). At 24 hpf expression is restricted to mainly rostral neural tissues (F, lateral view). This pattern is continued at 48 hpf (G, lateral view) with relatively high expression in the otic vesicle (ov) and the region of the midbrain–hindbrain boundary (mh) that develops into the cerebellum (see dorso-lateral view in E of the head of the embryo in G. Rostral is to the left). Size bars indicate 100 μm. In all images dorsal or animal pole is up except in F and G where dorsal is to the right and rostral is up. |
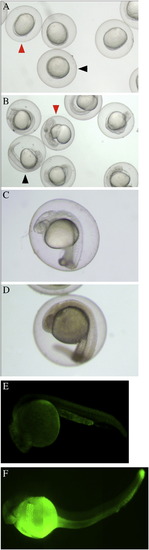
Zebrafish embryos arrest development when exposed to 900 μM NaN3 in embryo medium. A) 6 hpf embryos were collected and exposed to 900 μM NaN3 in embryo medium for 24 h. B) Embryos were washed out of the NaN3 solution into embryo medium and left to resume development for an additional 24 h (Red arrowheads indicate typical abnormal embryos. Black arrowheads indicate normal embryos). C) An embryo at 24 hpf before exposure to 900 μM NaN3. D) An embryo after exposure to 900 μM NaN3 for 24 h. Note the brownish tinge and reduced transparency. However, such embryos are able to resume apparently normal development. E and F) Acridine orange staining to examine cell death. E) An embryo at 24 hpf that has developed under normoxia. F) An embryo that was allowed to develop to 24 hpf under normoxia before exposure to 900 μM NaN3 for 24 h. It was then washed three times for 5 min. in embryo medium before staining and observation. |
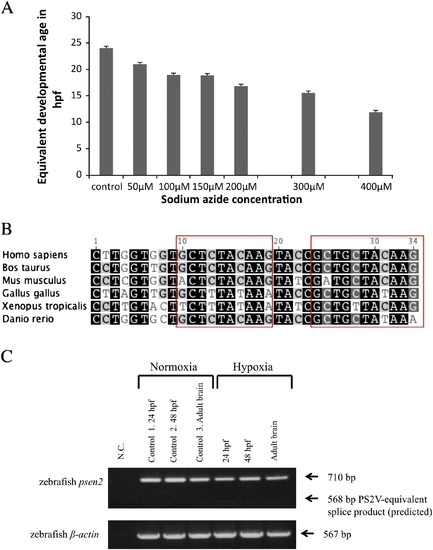
A) Histogram showing the developmental stage attained by embryos at 24 h after fertilization when incubated in various concentrations of NaN3 from 6 hpf. Developmental stage is given as equivalent to the developmental age in hpf of embryos developing under normoxia at 28.5 °C. B) Nucleotide sequence alignment of the 3′ end of exon 5 in human PSEN2 and its orthologues. Red boxes enclose sequences aligned with the HMGA1a-binding sites in human PSEN2. C) RT-PCR on cDNA from zebrafish embryos amplifying a region spanning psen2 exons cognate to human PSEN2 exons 3 to 7 under hypoxic conditions and predicted PS2V-like splice product size. N.C. is a negative control (no DNA template in the PCR). No PCR product is observed at the 568 bp position predicted if the zebrafish exon cognate with human PSEN2 exon 5 was to be excluded. |