
- Title
-
The zebrafish heart regenerates after cryoinjury-induced myocardial infarction
- Authors
- Chablais, F., Veit, J., Rainer, G., and Jazwinska, A.
- Source
- Full text @ BMC Dev. Biol.
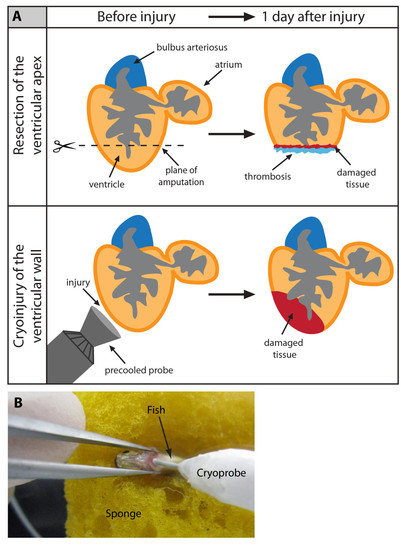
Cyroinjury compared to resection. (A) After amputation of the ventricular apex (upper panel), the damaged myocardium is restricted to the narrow layer of cells above the amputation plane. A blood clot fills up the missing tissue below the plane of amputation. After cryoinjury (lower panel), a large portion of the damaged apoptotic myocardium (red) remains integrated with the functioning organ. (B) A photograph of the cryoinjury procedure. A small incision of the zebrafish chest is opened with help of forceps. The cryoprobe is placed in contact with the ventricle. |
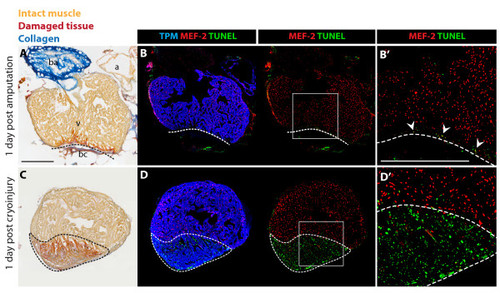
Massive cell apoptosis distinguishes cryoinjury from ventricular resection. (A and C) AFOG (Acid Fuchsin Orange-G) staining labels healthy muscle cells (light orange), damaged cells with plasma (dark orange), and collagen (blue). (B and D) Immunostaining with Tropomyosin (TPM) for cardiac muscle (blue), and nuclear MEF-2 as a marker for healthy cardiomyocytes (red). Apoptotic cells are detected by the TUNEL assay (green). (B′ and D′) Higher magnifications of the framed area in the left panels. (A-B) Adjacent longitudinal sections of the heart one day after ventricular resection. (A) The ventricle (v) comprises a narrow stripe of damaged cardiomyocytes (dark orange) just above the amputation plane (dashed line). Underneath the amputation plane a blood clot (bc) seals the wound; a, atrium; ba, bulbus arteriosus. (B-B′) A narrow layer of damaged TPM-positive myocardium above the amputation plane (dashed line) display enhanced apoptosis and reduced MEF-2 expression (arrowheads). (C-D) Adjacent cross sections of the heart one day after cryoinjury. (C) The ventricle encompasses a large disk-shaped damage (encircled with dashed line). (D-D′) This region contains abundant apoptotic TPM-positive cardiomyocytes that downregulate MEF-2 expression. Scale bars in (A-B′), 300 μm. |
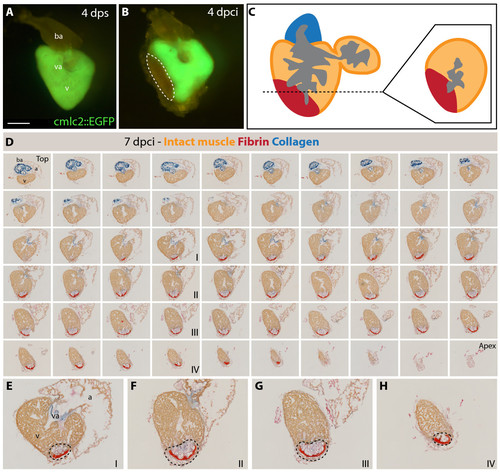
Analysis of the infarct size after cryoinjury. (A-B) Whole hearts of transgenic fish expressing GFP under control of cardiac specific promoter cmlc-2. (A) Uninjured ventricle at 4 days post sham (dps); v, ventricle; va, valve; ba, bulbus arteriosus; scale bar 300 μm. (B) At 4 days post cryoinjury (dpci), a portion of the ventricular wall is devoid of GFP expression, indicating the damaged myocardium (encircled by dashed line). (C) Schematic drawing demonstrating the plane of sectioning of the heart, which we applied in all our analysis. A typical cross-section is shown at the right side of the panel. (D) 7 dpci, a consecutive series of cross-sections of one heart from the top of the ventricle (left upper corner) to the ventricular apex (right bottom corner) labeled to AFOG staining to visualize the healthy myocardium in orange, fibrin in red and collagen in blue. (E-H) Higher magnification of selected images shown in (D). The post-infarct zone (black dashed line) expands from the apex to approximately a half-length of the ventricular wall. In our morphometric analysis, the measurement of the infarct volume was taken from all the sections of six hearts at different time points after injury. v, ventricle; va, valve; ba, bulbus arteriosus; a, atrium. |
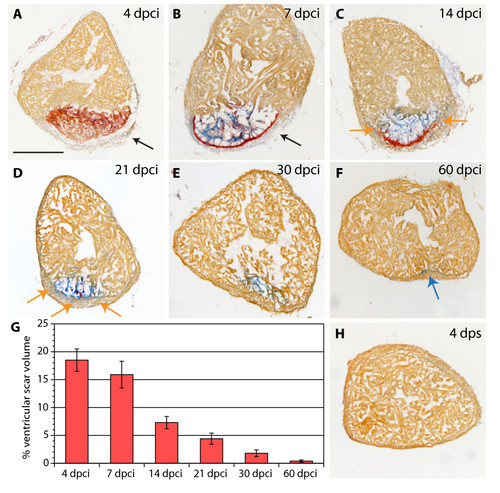
Scar formation and resorption during healing of myocardial infarction after cryoinjury. (A-F and H) Heart sections stained with AFOG representing the subsequent stages after cryoinjury. (A) At 4 dpci (days post cryoinjury), the damaged myocardium (dark orange) becomes surrounded by non-muscle cells (light gray, denoted by arrow). (B) At 7 dpci, a fibrin layer (red) forms along the inner side of the wound margin that consists of non-myocytes (arrow). The central part of the post-infarct consists of a loose collagen network (blue). (C) At 14 dpci, the edges of the fibrin layer (red) resolve and are replaced by new myocytes (orange arrow). The central part of the post-infarct contains abundant collagen fibers (blue). (D) At 21 dpci, a wall of cardiac tissue surrounds the entire infarct (orange arrows). Fibrin (red) is markedly reduced, while the collagen fibers (blue) persist. (E) At 30 dpci, no fibrin is visible. The collagen-containing area has markedly decreased. (F) At 60 dpci, the infarct scar is nearly completely resolved. Only occasionally, a few collagen fibers are detected (blue arrow). (G) A change of the scar size relative to the entire ventricle at different stages after injury. For measurements, all cross sections of six hearts per time point were analyzed. (H) In control, at 4 dps (days post sham), no fibrin or collagen fibers are present. Scale bar in (A), 300 μm. |
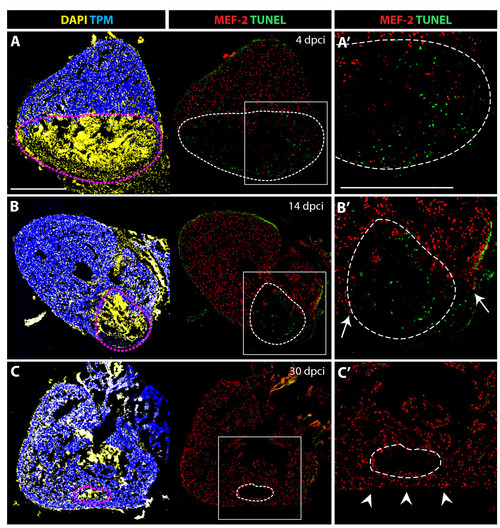
Cell apoptosis during the replacement of the scar with a new myocardium. (A-C) Confocal images of quadruple-stained cross-sections of hearts at different time points after cryoinjury. Cardiomyocytes are labeled by the presence of TPM (blue) and MEF-2 (red). All the nuclei are visualized by DAPI (yellow) and the apoptotic cells are detected by the TUNEL assay (green). Dashed lines encircle the scar. (A′, B′ and C′) Higher magnifications of framed area shown in left panels. (A-A′) At 4 dpci, a large infarct area is devoid of cardiomyocytes, and it contains abundant apoptotic cells. (B-B′) At 14 dpci, numerous non-myocytes located in the infarct zone undergo apoptosis. Arrows indicate new myocardium invading the post-infarct. (C-C′) At 30 dpci, cell apoptosis is no longer detected in the remaining post-infarct region. Cardiomyocytes have replaced a large portion of the wound, and only a small area lacks cardiomyocytes. Arrowheads denote a new myocardial wall. Scale bars in (A-A′) represent 300 μm. |
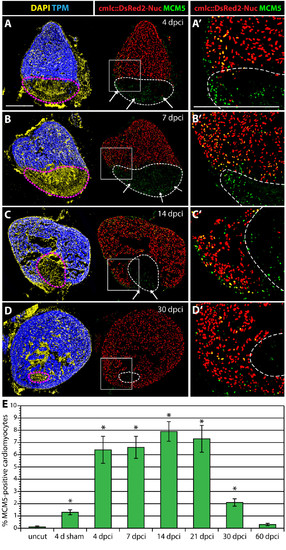
Enhanced cardiomyocyte proliferation during heart regeneration. (A-D) Confocal images of the heart from transgenic fish expressing nuclear DsRed2Nuc under the control of cmlc-2 cardiomyocyte-specific promoter. Immunostaining for Tropomyosin (blue) labels the myocardium, MCM5 (green) detects mitotic cells and DAPI (yellow in the left panels) marks all the nuclei. Proliferating cardiomyocytes are identified by the co-expression of DsRed2-Nuc and MCM5. Dashed line denotes the post-infarct. (A′, B′, C′ and D′) Higher magnifications of the framed area in the left panels. At 4 dpci (A-A′), 7 dpci (B-B′), 14 dpci (C-C′) and 30 dpci (D-D′), many proliferating cardiomyocytes are located in the vicinity of the post-infarct. At 4, 7 and 14 dpci, a layer of proliferating non-myocytes surrounds the periphery of the scar (arrows in A, B and C). Bars in (A and A′), 300 μm. (E) Ratios of MCM5/DsRed2-Nuc-positive nuclei relative to DsRed2-Nuc nuclei. (n = 10, 2 representative sections of 5 hearts, *P < 0.01 compared to uncut). |
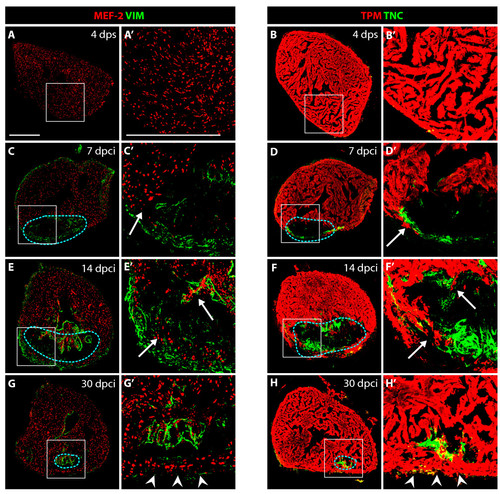
VIM-positive fibroblasts and TNC localize at the border zone between the myocardium and fibrotic tissue. (A, C, E and G) Heart sections immunostained for a cardiac nuclear marker MEF-2 (red) and an intermediate filament marker Vimentin (VIM, green). (B, D, F and H) Heart sections immunostained for a cardiac sarcomeric marker TPM (red) and an extracellular de-adhesive protein Tenascin-C (TNC, green). (A′, B′, C′, D′, E′, F′, G′ and H′) Higher magnifications of the framed area in the left panels. (A-A′ and B-B′) In control, at 4 days after sham operation, no significant expression of VIM and TNC can be detected in the ventricle. (C-C′ and D-D′) At 7 dpci, the scar margin and the interface between the myocardium and post-infarct are highlighted by VIM- and TNC-expressing fibroblasts. (E-E′ and F- F′) At 14 dpci, protrusions of cardiomyocytes expand along VIM/TNC-expressing cells (arrows). (G-G′ and H-H′) At 30 dpci, the scar tissue is largely replaced by cardiomyocytes. A new compact myocardial wall (arrowheads) surrounds residual VIM and TNC. Dashed line encircle the post-infarct. Bars in (A-A′), 300 μm. |
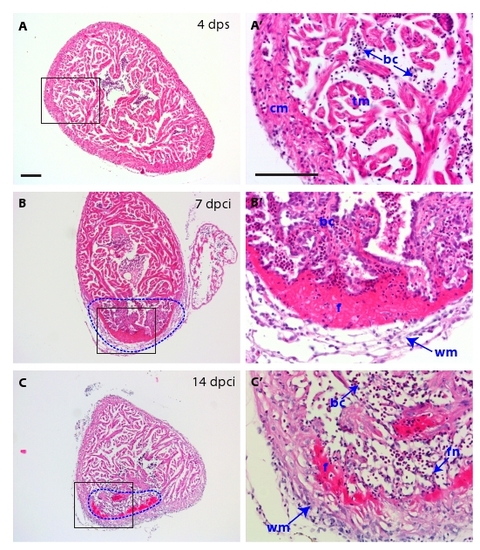
H&E histological analysis of the scar and of the inflammatory response. (A-C) Heart cross-sections stained with Hematoxylin (dark purple) to visualize nuclei and Eosin (pink) to detect proteins. (A′, B′ and C′) Higher magnifications of framed area shown in left panels. (A-A′) At 4 dps, the intact ventricle is surrounded by the compact myocardium. The middle part of the ventricle consists of trabecular myocardium. (B-B′) At 7 dpci, the scar tissue (dashed line) is infiltrated by inflammatory cells. A network of fibroblasts surrounds the outer border of the infarct. A layer of acellular matrix accumulates at the inner side of this border. (C-C′) At 14 dpci, the compact myocardium starts to invade the outer margin of the scar. The interior of the post-infarct is composed of a network of spindle-shaped fibroblasts, which is infiltrated by blood cells. cm, compact myocardium; tm, trabecular myocardium, bc, blood cells; f, fibrin; wm, wound margin; fn, fibroblast network in the interior of the scar. Scale bars in (A-A′) represent 300 μm. |
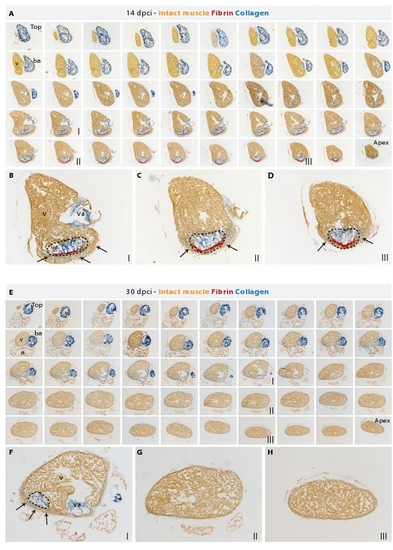
A new myocardium surrounds the post-infarct area during heart regeneration. (A and E) AFOG staining of a consecutive series of transverse sections of a heart at 14 dpci (A) and at 30 dpci (E) from the top of the ventricle (left upper corner) to the ventricular apex (right bottom corner); v, ventricle; va, valve; ba, bulbus arteriosus; a, atrium. (B-D) Higher magnification of selected images shown in (A). The post-infarct zone (dashed line) containing fibrin (red) and collagen (blue) expands from the apex to approximately a half-length of the ventricular wall. New cardiac tissue (orange) begins to surround the post-infarct (arrows). (F-H) Higher magnification of selected images shown in (E). The post-infarct zone (dashed line) is detected only at the level of the artioventricular valves (F), and it is completely replaced by a new myocardium in the apex and the lower part of the ventricle (G and H). (F) A wall of cardiac tissue surrounds the remaining collagenous scar (arrows). |
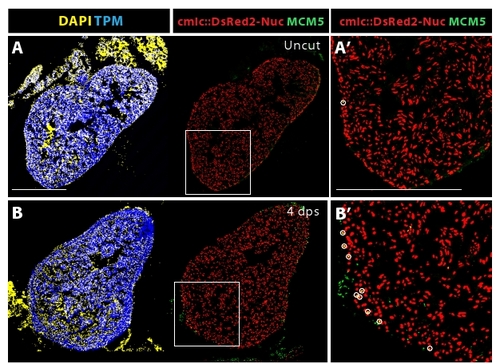
Sham surgery triggers a cell-cycle entry of the cardiomyocytes in the vicinity the epicardium. (A-B) The nuclei of cardiomyocytes express DsRed2-Nuc protein under the control of cmlc-2 promoter. Tropomyosin (blue) labels the myocardium, MCM5 (green) is expressed in the mitotic cells, DAPI marks all the nuclei. Proliferating cardiomyocytes are identified by the co-expression of DsRed2-Nuc and MCM5 (circles). (A′ and B′) Higher magnifications of framed area shown in left panels. (A-A′) Uninjured animals display a very few proliferating cardiomyocytes in the ventricle. (B-B′) The ventricle of animals at 4 days sham-operation contains an enhanced number of DsRed2-Nuc/MCM5-positive nuclei at the myocardial periphery, underneath the epicardium. Bars in (A-A′) represent 300 μm. |
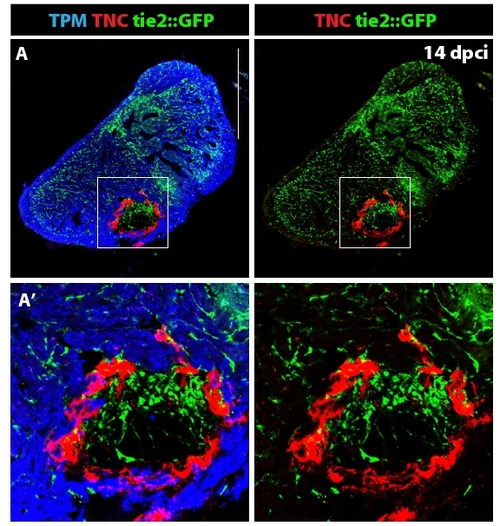
Distribution of the endothelial cells in the ventricle at 14 dpci. (A) The endothelial cells express GFP under the control of tie-2 promoter [45]. Tropomyosin (blue) labels the myocardium, TNC (red) is expressed in the post-infarct zone. (A′) Higher magnification of the framed area in (A) demonstrates formation of new blood vessels in the post-infarct area. Tenascin-C outlines the boundary between the invading myocardium and the injury site. Scale bar in (A) represents 300 μm. |
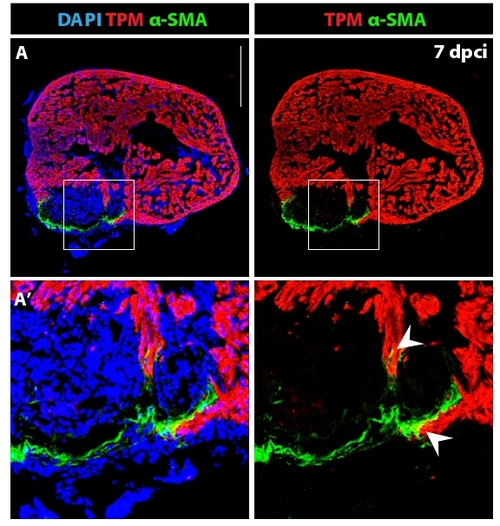
Fibroblasts with contractile filaments constitute the wall of the post-infarct. (A) Heart section immunostained for a cardiac marker Tropomyosin (red), a myofibroblast marker alpha smooth muscle actin (green) and DAPI (blue). The outer rim of the post-infarct is surrounded by myofibroblasts. (A′) Higher magnification of the framed area in (A) reveals fibroblast-cardiomyocyte coupling at the edge of the invading myocardium (arrowheads). Scale bar in (A) represents 300 μm. |