
- Title
-
Nitric oxide permits hypoxia-induced lymphatic perfusion by controlling arterial-lymphatic conduits in zebrafish and glass catfish
- Authors
- Dahl Ejby Jensen, L., Cao, R., Hedlund, E.M., Söll, I., Lundberg, J.O., Hauptmann, G., Steffensen, J.F., and Cao, Y.
- Source
- Full text @ Proc. Natl. Acad. Sci. USA

Hypoxia-induced lymphatic perfusion in the tailfin. (A) EGFP-positive signals in the tailfin of fli1:EGFP fish were compared with those in VEGFR2:EGFP fish. The tailfin of VEGFR2:EGFP zebrafish shows a subset of EGFP-positive structures as compared with those of fli1:EGFP zebrafish. Schematic presentation indicates the proximal (P) and distal (D) regions of the tailfin. Blue represents veins, red represents arteries, and green indicates lymphatic vessels. (B) Prox-1 immunohistochemical staining shows that a portion of the fli1:EGFP-positive vasculature is stained with prox-1 (red color, arrows). (Scale bar, 50 μm.) (C) Bright-field microscopic examination of proximal and distal regions of the tailfin under conditions of tissue normoxia and hypoxia. In both distal and proximal regions, hypoxia increases lymphatic dilation (diameters of vessels marked by blue dashed lines) and blood perfusion (blood cells in proximal region, marked with red dots in the distal region). FR, fin ray; M, melanocyte. (Scale bar, 50 μm.) (D) Hypoxia-induced rhodamine (Rh)-dextran perfusion in the lymphatic system of both proximal and distal regions. The bottom row of figures shows merged images of fli1:EGFP expression and Rh-dextran fluorescence. Arrows indicate lymphatic vessels. (Scale bar, 50 μm.) |
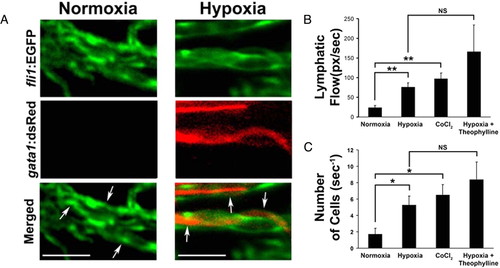
Increase in blood perfusion in the lymphatics by hypoxia. (A) Hypoxia-induced blood perfusion was revealed using fli1:EGFP and gata1:dsRed double-transgenic fish. Arrows indicate lymphatic vessels. (Scale bar, 20 μm.) Quantification of (B) lymphatic perfusion and (C) blood cells in zebrafish lymphatics under normoxia, hypoxia, exposure to CoCl2, and hypoxia plus theophylline exposure. *, P < 0.05, **, P < 0.01, and ***, P < 0.001. |
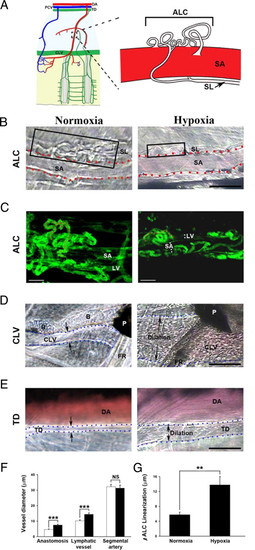
Hypoxia-induced linearization of arterial-lymphatic conduits (ALCs), lymphatic dilation, and blood perfusion in zebrafish and K. bicirrhis. (A) Schematic presentation of the ALC in the adult K. bicirrhis, with an expanded view of an ALC and its associated segmental artery (SA). DA, dorsal aorta; CLV, collecting lymphatic vessel; PCV, posterior cardinal vein; SL, segmental lymphatic; TD, thoracic duct. (B) Bright-field micrographs of ALCs in K. bicirrhis under normoxia and hypoxia. Black boxes show the ALCs. Dashed lines mark the SAs. (Scale bar, 50 μm.) (C) ALCs are found in the zebrafish tail region close to the SA and the lymphatic vessel (LV), as shown by EGFP-positive structures in fli1:EGFP zebrafish. ALCs budded from SAs and appeared as “tangled” compact corkscrew vascular plexuses (red dashed lines). Under hypoxic conditions, the compact, tangled architecture became linearized. (Scale bar, 20 μm.) (D) Hypoxia-induced dilation and blood perfusion in the CLV. Dashed blue lines mark the border of the CLV. B, bone; P, pigment; FR, fin ray. (Scale bar, 100 μm.) (E) Dilation of the TD under hypoxic conditions. Dashed blue lines mark the border of the TD, which became perfused under hypoxic conditions. (F) Quantification of averages of vessel diameters of the ALC, lymphatic vessel, and segmental artery under normoxia and hypoxia. ***, P < 0.001. NS, not significant. The open bars presents the values under normoxia and filled bars indicate the values under hypoxia. (G) Quantification of linearization of ALCs under normoxia and hypoxia. **, P < 0.01. |

Hypoxia-induced lymphatic perfusion is dependent on NO. (A) Tailfin lymphatic perfusion under normoxia. (Scale bar, 50 μm.) (B) Tailfin lymphatic perfusion under normoxia in zebrafish treated with 100 μM sodium nitroprusside (SNP). Under hypoxic conditions, tailfin lymphatic perfusion of (C) control zebrafish (vehicle), and zebrafish treated with (D) 1 μM l-NMMA, (E) 1 μM ODQ, (F) 10 μM c-PTIO, (G) 1 μM l-NMMA + 100 μM SNP, and (H) 1 μM ODQ + 100 μM SNP. Dashed blue lines mark the border of the lymphatics, and red dots indicate blood cells. (I) Quantification of blood cells in tailfin lymphatics under different conditions. ***, P < 0.001; NS, not significant. |
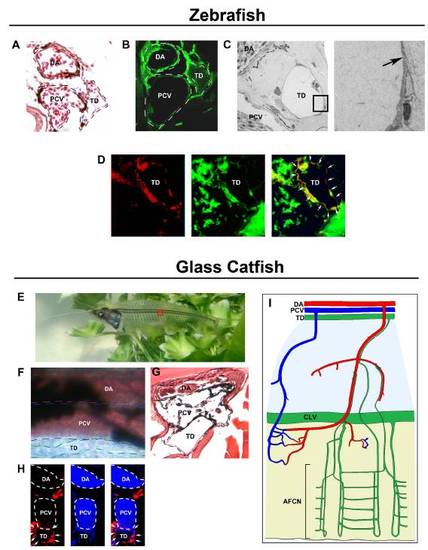
The lymphatic system in zebrafish and K. bicirrhis. Cross-sections of the fli1:EGFP zebrafish trunk region were (A) stained with H&E or (B) examined by fluorescence microscopy for EGFP expression (green). (C) Electron microscopic examination of the thoracic duct (TD). Arrow indicates a lymphatic valve of the TD. (D) A cross-section of fli1:EGFP zebrafish trunk tissue was immunohistochemically stained with anti-prox-1 (red), demonstrating overlapping positive signals with EGFP (arrows). (E) The boxed region of transparent K. bicirrhis was used to examine blood flow and the TD. (F) Whereas blood flow and red blood cells were easily detectable in the dorsal aorta (DA) and portal cardinal vein (PCV), the TD lacked blood perfusion. (G) H&E staining showed the location of the TD next to the PCV. (H) Immunostaining of K. bicirrhis trunk tissue with anti-prox-1 (red) and with DAPI to show erythrocyte nuclei (blue) showed that the TD was positive for prox-1 (arrows) and lacked erythrocytes (encircled with dashed lines). (I) Schematic presentation of the anatomy of the arterial, venous, and lymphatic systems [adapted from Steffensen JF, Lomholt JP, Vogel WOP (1986) In vivo observations on a specialized microvasculature, the primary and secondary vessels in fishes. Acta Zoologica (Stockh.) 67:193–200]. SA, segmental artery; SV, segmental vein; FR, fin ray; CLV, collecting lymphatic vessel; AFCN, anal fin capillary network. (Scale bar, 50 μm.) |