a. SEM morphology of the fabricated PNIPAM-NG shows the cross-linking and mesh like nature at 20 min polymerization time for 60 °C. Size of the synthesized NG. Both DLS (b) and TEM (c) images showed the particle size range from 40 to 65 nm.

a. UV-vis spectrum of the NG with or without conjugated components shows peaks respective of the components. b. TEM image of TT loaded NG. The TT loaded NGs diameter increased from 80 nm to 120 nm and were spherical in shape with a smooth surface and good dispersion.

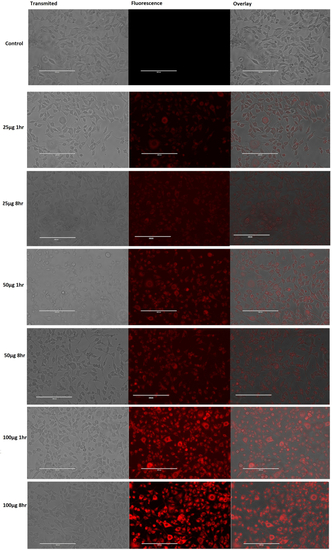
Cellular uptake of NGs in fibroblast cells observed using EVOS inverted microscope.

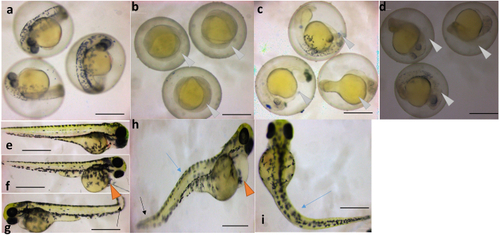
Toxicity evaluation of NG, NG + TT, and TT in developing zebrafish (Danio rerio). (a) Control 24 hpf embryo. (b) NG treated embryos at 24 hpf had slow growth at treatments above 300 μg/ml (white arrowhead). NG + TT treated embryos at (c) 24 hpf showed slower growth in the 250 μg/ml treatment group (white arrowhead). TT treated embryos also had a developmental delay at (d) 24 hpf in the 1.2 μg/ml treatment group (white arrow head). (e) 72 hpf control fish. (f) At 72 hpf pericardial edema was observed in the 300 μg/ml NG treatment group (red arrowhead). (g) Bent tail (black arrow) was seen in 72 hpf larvae in the 1.1 μg/ml TT treatment group. (h) At 72 hpf, bent tail (black arrow), spinal kyphosis (blue arrow), and pericardial edema (red arrowhead) were observed in the 200 μg/ml NG + TT treatment group. (i) Spinal kyphosis (blue arrow) was also observed in the 1 μg/ml TT treatment group. Scale bars are 1 mm.

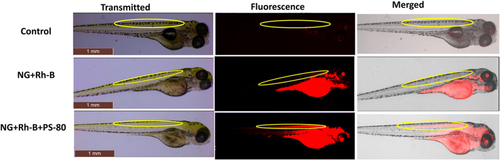
The NG conjugates were microinjected into the aortic region of zebrafish larvae to examine the possibility of crossing the BBB in vivo via apolipoprotein receptor-mediated endocytosis. NG + PS80, NG + Rh–B, and NG + Rh–B + PS80 bright field images of microinjected zebrafish larvae (transmitted), fluorescent image (fluorescence), and grayscale + fluorescent merged image (merged). NG + PS80 and NG + Rh–B overlapped image of grayscale and red fluorescence showed no targeted delivery of NG to the CNS due to lack of fluorescence property or inability to cross BBB, respectively. The NG + Rh–B + PS80 overlapped image of grayscale and red fluorescence shows targeted delivery of NG to CNS. The yellow marked region is the spinal cord of zebrafish larvae.

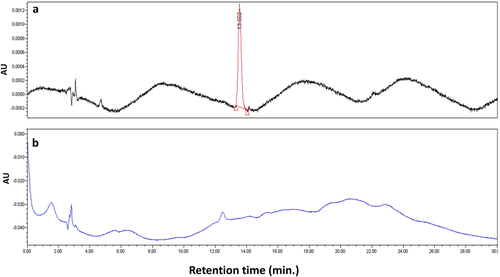
RP-HPLC analysis of TT delivery in adult zebrafish brain. (a) NG + TT with PS80, chromatogram where the TT peak (red) is observed in zebrafish brain at 13.56 min. (b) NG + TT without PS80 treated zebrafish brain, where no TT peak is observed in the chromatogram.

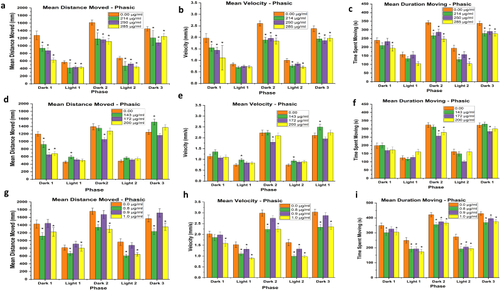
Visual motor response assay in zebrafish larvae at 120 hpf exposed to concentrations below, at, and above the 96 hpf-LC50 for NG (a–c), NG + TT (d–f), or TT (g–i). Error bars represent standard error. ∗p < 0.05, N = 4 with 24 subsamples per treatment in each replicate to total 96 larvae per treatment.

Expression analysis of genes associated with AD (apoea, apoeb, appab, appb, and psen1) in the NG, NG + TT, or TT exposed zebrafish larvae at 120 hpf. Error bars indicate standard error from biological replicates in each group. Zebrafish gapdh was used as a reference gene. ∗denotes a significant gene expression difference between the control and treatment groups (p < 0.05), N = 3.

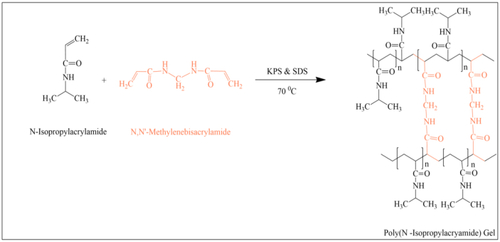
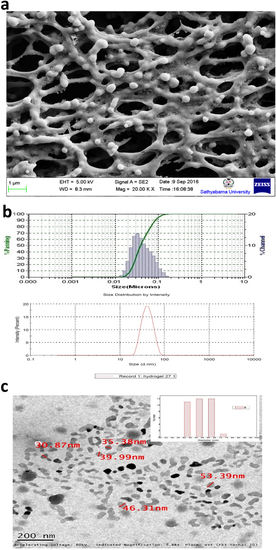
Scheme of PNIPAM-NGs synthesis.

Acknowledgments
This image is the copyrighted work of the attributed author or publisher, and ZFIN has permission only to display this image to its users. Additional permissions should be obtained from the applicable author or publisher of the image. Full text @ Heliyon