
- Title
-
Slow muscles guide fast myocyte fusion to ensure robust myotome formation despite the high spatiotemporal stochasticity of fusion events
- Authors
- Mendieta-Serrano, M.A., Dhar, S., Ng, B.H., Narayanan, R., Lee, J.J.Y., Ong, H.T., Toh, P.J.Y., Röllin, A., Roy, S., Saunders, T.E.
- Source
- Full text @ Dev. Cell
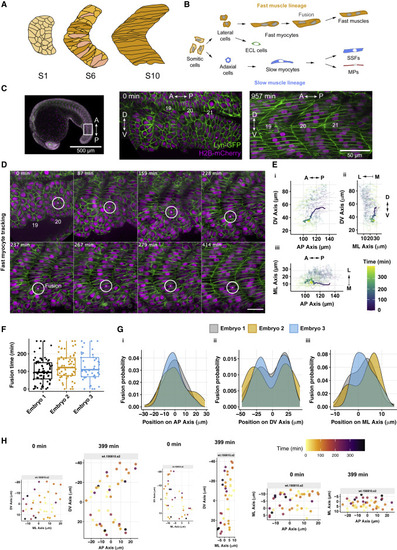
Figure 1. In toto quantification of cell migration and fusion events during myotome formation (A) Schematic of zebrafish myotome development in the AP-DV plane, from immediately after somite segmentation from the PSM to formation of the initial myotome segment. Color coding highlights cell elongation. (B) Schematic of muscle fiber differentiation. Slow fibers remain mono-nucleated and have two subpopulations: muscle pioneers (MPs, red) and superficial slow fibers (SSFs, blue). The lateral cells differentiate mainly into the future fast fibers (orange), which become multinucleated during development, and a smaller subset that forms the external cell layer (ECL). (C) Left: view of a 19-somite stage embryo. (Middle) Somites 19–21, just after the segmentation of somite 21 from the PSM (defined as t = 0). Right: somites 19–21 16 h later. (D) Example of fast myocyte tracking. The position in the ML axis is altered to maintain the center of the nucleus in the plane shown. Scale bar, 50 μm. (E) Tracks of fast myocytes in a complete myotome segment (orthogonal views), with the myocyte from (D) highlighted with thicker lines. Color coding represents the time from segmentation. Positions defined by the spatial coordinates from the (movement corrected) movie. (F) Timing of fusion events. Time t = 0 corresponds to the first fusion event for each segment. Box represents 95% confidence interval (CI), with the bar indicating the median. (G) Spatial distribution of fusion events in (Gi) AP, (Gii) DV, and (Giii) ML axis. Position 0 μm in each axis corresponds to the segment center. (F and G) Data from 9 segments from 3 embryos. (H) Position of cells immediately after segmentation from the PSM (t = 0 min) and 400 min later for a representative segment. Color coding represents the time of individual fusion events. Positions defined as in (G). |

Figure 2. Cell shape prior to fusion is highly heterogeneous (A) Top: example of images of cell shape from segmentation to fusion. Bottom: morphospace of fusing cells, defined with respect to the time from somite segmentation (t = 0 min). Individual dots represent the onset of fusion. Aspect ratio (Aiii) defined as the ratio of long to short axes of the best fitting ellipse to the cell cross-sectional shape. Scale bar, 10 μm. (B) Morphospace of fusing cells, defined with respect to their time before fusion (t = 0 represents the time when each cell fused). Shaded regions indicate 95% CI. (C) Relative morphospace of fusing cells, where the larger value of the two cells is in the numerator at each time point (hence, relative value is always greater than 1). Shaded regions indicate 95% CI (STAR Methods). Time defined as in (B). (A–C) 60 cells, from 4 segments from 2 embryos. (D) Example of fusing cell pairs, highlighting the cell perimeter, with color representing time. The rounder cell is positioned on top. Time defined as in (B). Scale bar, 10 μm. (E) Boundary capture analysis at fusion. 45 fusion events, from 3 myotome segments from 1 embryo. Scale bar, 10 μm. (F) Image of nocodazole-treated embryo (right, control on left) injected with lyn-gfp and h2b-mcherry mRNA. Left: scale bars, 50 μm. Right shows a close-up view of selected fused cells. Scale bars, 10 μm. Fusion events highlighted by white arrowheads. Time defined as in (B). |

Figure 3. Cell fusion events are biased along, but not restricted to, the AP axis and do not show a local bias in position (A) Angle of fusion events relative to tissue AP axis. Left: cartoon of angle definition, with the data distribution shown as a rose plot and the total number of events represented by increasing radius. Red bracket highlights the fraction of cells with fusion angle >30°. (B) As (A), but for the angle of fusion events relative to tissue ML axis. Red bracket highlights the fraction of cells with fusion angle away from ML axis by more than 30°. (A and B) 84 fusion events from 2 embryos. (C) Example of fusion events along different axes. Left: two fast myocytes fusing end-to-end. Right: two fast myocytes fusing side-by-side. Time t = 0 represents fusion time. (D) Left: location of fusion initiation within each fusing cell. Right: orientation of fusing pairs relative to each other. (E) Distribution of end-to-end and side-to-side fusion events. Position 0 μm in each axis corresponds to the segment center, determined by the average cell position. (D and E) 90 cells, 3 myotome segments from 1 embryo. |

Figure 4. Fusion events cannot be predicted by initial cell position and occur in a ML wave (A) Example of fast myocyte fusion pair tracking. ML plane chosen such that the yellow highlighted cell is kept in the observed plane. The white highlighted cell is in a different ML plane in some images (hence overlap). Time t = 0 represents segmentation from the PSM. (B) Euclidean distance in 3D between fusing pairs and (B′) distance between the nucleus centroid of fusing cells along different axes. Shaded regions correspond to ±1 SD (348 cells from 3 embryos). Time t = 0 represents fusion time. (C) Left: points represent cell location immediately after segmentation for a somite. Position 0 μm in each axis corresponds to the segment center, determined by average cell position. Four regions are selected within the segment (colored boxes on left). Right: for each selected region, a cell at the same location in each of the 9 somites immediately after segmentation is identified (black point). The corresponding position of the fusing partner (other colored points) was plotted from each segment, with the position of the reference cell defined as (0,0,0). As we are comparing the local position of fusing cells, we define the selected cell to be at (0,0,0) in the (AP, DV, and ML) axes. (D) Network connections of fusing cells immediately after somite segmentation and 15 h later. Color coding represents Euclidean distance. (E) Statistical analysis (STAR Methods) of network interactions against the null hypothesis that connections are random in each axis direction. Colors represent 3 different embryos. (F–H) Nuclear position of fusing cells, color coded by their fusion state in DV-ML (F), DV-AP (G), and ML-AP (H) axes. Time defined as in (A). Position 0 μm in each axis corresponds to the segment center, determined by average cell position. |

Figure 5. Slow muscle position and mymk expression correlate with fusion (A) Fluorescent in situ hybridization (FISH) showing mymk expression (magenta) in a 22-somite stage embryo expressing prdm1a::GFP, co-stained with DAPI for labeling nuclei (cyan) and GFP (yellow, stained for anti-GFP) to mark slow fiber population. Scale bars, 20 μm. (B) FISH expression profile of mymk along the ML axis in different somite stages from 3 embryos, normalized by maximum mymk FISH intensity for each embryo and average DAPI intensity at each z stack. Position 0 μm corresponds to the notochord/myotome boundary. (C) mymk expression domain (gray region, with mean ± SD shown by hexagons and error bars, respectively) and localization of fusion events (black dots). Correlation between the FISH data and the fusion events obtained by live imaging is described in STAR Methods. Distance as in (B). (D) (Di) Scheme showing the definition of fast myocyte fusion timing. (Dii) Position of slow and fast myocytes during fusion in DV-AP axes immediately after somite segmentation (t = 0 min) and at the end of imaging (t = 891 min). (Diii) Based on (Dii), the tracks of slow and fast myocytes from somite segmentation to fusion in the AP axis. (Div)–(Dvii) as (Dii) and (Diii) but in ML-AP axes (Div and Dv) and ML-DV axes (Dvi and Dvii). Position 0 μm in each axis corresponds to the segment center, determined by average cell position. (E) Distance between each fast myocyte to the nearest slow muscle fiber, where t = 0 is determined by fusion time of each cell. 356 fast myocytes and 118 slow myocytes from 9 myotome segments from 3 embryos. Single-cell tracks shown in gray. (F) Close-up images of fast myocyte fusion. Fusion event highlighted by arrow. Slow myocyte (expressing prdm1a::GFP) outlined by white dashed line. (G) Example tracks in DV-ML plane, showing two fusing cells and path of nearest slow fiber. |
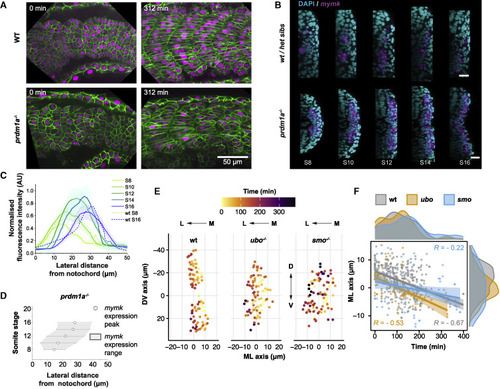
Figure 6. Loss of slow fibers results in the alteration of spatiotemporal dynamics of fast myocyte fusion (A) ubo mutant at 22-somite stage expressing Lyn-GFP (cell membrane, green) and H2B-mCherry (nuclei, magenta) with sibling control. Scale bars, 50 μm. Time t = 0 represents segment generation from the PSM. (B) Localization of mymk expression (magenta) visualized by FISH in a ubo mutant embryo at 22-somite stage co-stained with DAPI (nuclei, cyan), with sibling control. Scale bars, 20 μm. (C) Expression profile of mymk along the ML axis in different somite stages of ubo mutant embryos. Data from three embryos, with intensity normalized as Figure 5B. Dashed lines show comparison for wild-type embryos (from Figure 5B) in S8 and S16. Position 0 μm corresponds to the notochord/myotome boundary. (D) mymk expression domain (gray region, with mean ± SD shown by hexagons and error bars, respectively) in ubo mutants in the ML axis at different somite stages. Data from 3 embryos, distance as in (C). (E) Spatial distribution of fusion events in DV-ML axes in wild-type, ubo, and smo mutant embryos. Nuclei positions at the time of fusion color coded by time normalized to the first fusion event per individual myotome. Position 0 μm in each axis corresponds to segment center, determined by average cell position. (F) Timing of fusion events along ML axis in wild-type, ubo, and smo embryos. Darker colored lines represent linear fit, with lighter colored regions denoting the 95% CI. Time t = 0 min defined by the first fusion event, and ML position 0 μm corresponds to average cell position in ML axis for each segment. (E and F) Wild-type (179 fusion events from 9 myotomes from 3 embryos), ubo− (45 fusion events from 3 myotomes from 1 embryo), and smo (46 fusion events from 3 myotomes from 1 embryo). |
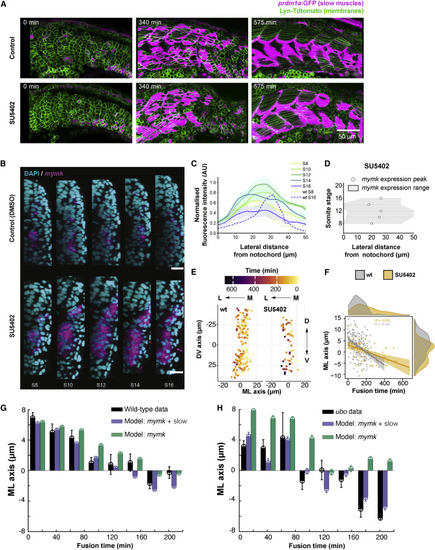
Figure 7. Spatiotemporal fusion dynamics altered by disrupting myocyte specification and rearrangements (A) Images of the developing myotome in SU5402-treated embryos during fusion, with wild-type control. Time t = 0 represents segment generation from the PSM. (B) Localization of mymk expression (magenta) visualized by FISH in an embryo treated with SU5402 (and control treated with the vehicle) and visualized at 22-somite stage co-stained with DAPI (nuclei, cyan). Scale bars, 20 μm. (C) Expression profile of mymk along the ML axis in different somite stages of SU5402-treated embryos. Data from three embryos, with intensity normalized as described in STAR Methods. Dashed lines show comparison for wild-type embryos (from Figure 5B) in S8 and S16. Position 0 μm corresponds to notochord/myotome boundary. (D) mymk expression domain (gray region, with mean ± SD shown by hexagons and error bars, respectively) from three SU5402-treated embryos in the ML axis at different somite stages. Distance as in (C). (E) Spatial distribution of fusion events in DV-ML axes in SU5402-treated embryo (right) compared with wild-type (left). Fusion events color coded by time normalized to the first fusion event per individual myotome. (F) Timing of fusion events in SU5402-treated embryos (gray) compared with wild-type (orange). The distributions show the spread of fusion timing and spatial position in ML axis (where 0 μm corresponds to the average ML position of the cells in each segment). Time t = 0 defined by the first fusion event. (E and F) 9 myotome segments from 3 embryos for wild-type and 3 myotome segments from 1 embryo in SU5402 treated. (G and H) Model predicting the timing of fusion events along the ML axis in wild-type (G) and ubo (H) embryos. Black: experimental data (from Figures 5 and 6). Purple: model prediction (STAR Methods) based on both mymk expression and slow fiber movement. Green: model prediction (STAR Methods) based on mymk expression alone. Error bars = SEM. Time and position defined as in (F). |
Reprinted from Developmental Cell, 57(17), Mendieta-Serrano, M.A., Dhar, S., Ng, B.H., Narayanan, R., Lee, J.J.Y., Ong, H.T., Toh, P.J.Y., Röllin, A., Roy, S., Saunders, T.E., Slow muscles guide fast myocyte fusion to ensure robust myotome formation despite the high spatiotemporal stochasticity of fusion events, 2095-2110.e5, Copyright (2022) with permission from Elsevier. Full text @ Dev. Cell