FIGURE SUMMARY
Title

Control of dynamic cell behaviors during angiogenesis and anastomosis by Rasip1

Authors
Lee, M., Betz, C., Yin, J., Paatero, I., Schellinx, N., Carte, A.N., Wilson, C.W., Ye, W., Affolter, M., Belting, H.G.
Source
Full text @ Development

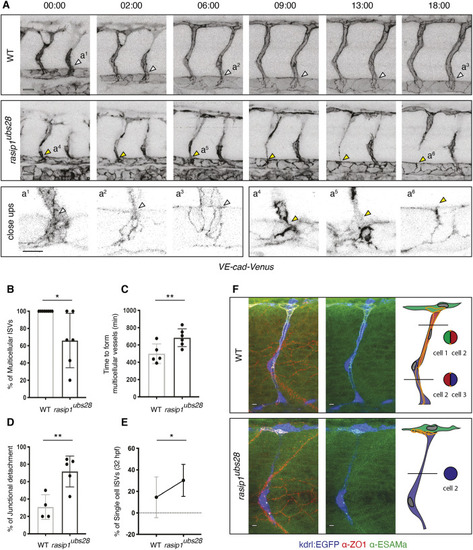
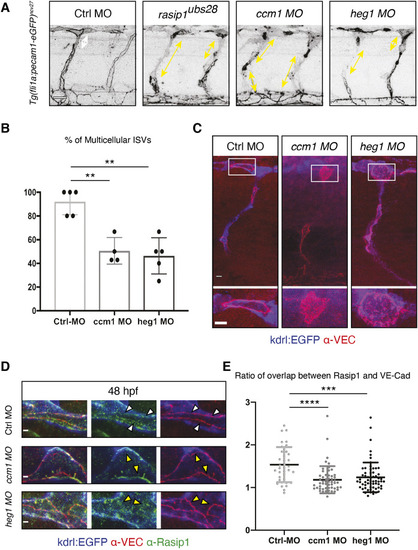
Formation of multicellular vessels is impaired in rasip1 mutants. (A) Still images of time-lapse movies showing endothelial cell junctions (Cdh5-Venus) in wild-type (WT) and rasip1ubs28 embryos (Movies 1 and 2). White arrowheads show maintained junctional contacts in wild-type ISV sprouts. Yellow arrowheads indicate junction detachment in mutant embryos. Bottom row shows close-ups (a1-a3: wild type; a4-a6: mutant) showing junctional detachment in a4 and a5. Scale bars: 20 μm. (B-E) Quantification of junctional and cellular configuration during ISV formation in wild-type and rasip1ubs28 mutant embryos. (B) Percentage multicellular tubes at 48 hpf (WT n=8, mutant n=6). (C) Speed of multicellular tube formation (WT n=5, mutant n=6). (D) Percentage of ISVs per embryo showing junctional detachment (WT n=4, mutant n=5). (E) Percentage of single-cell ISVs at 32 hpf (WT n=8, mutant n=8). Quantifications were performed by counting ISVs showing the respective phenotypes, averaged by total ISVs analyzed per embryo. (F) Immunofluorescence staining of ZO-1 and Esama in Tg(kdrl:EGFP)s843 at 32 hpf. Schematics on the right show the different cellular configurations of multicellular (WT) and unicellular (rasip1 mutant) ISVs. Scale bars: 5 μm. The data were analyzed by unpaired two-tailed Mann–Whitney test (*P<0.1, **P<0.01); error bars indicate s.d.

Requirement of Rasip1 for dynamic re-localization of junctional proteins and junctional ring formation during anastomosis. (A-C) Still images of time-lapse movies showing normal junctional patch-to-ring transformation in wild type (WT) (A; Movie 3) and aberrant ring formation in rasip1ubs28 mutants (B,C; Movies 4 and 5). Transgenic embryos expressing a VE-cadherin-Venus fusion protein were imaged, starting at 30 hpf. Scale bar: 5 μm. (D) Immunofluorescence analysis of ZO-1 and VE-cadherin in Tg(kdrl:EGFP)s843 at 32 hpf. rasip1ubs28 mutant shows reticulated junctions between two cells in the DLAV; wild-type embryo forms a cleared apical compartment and a ring-shaped junction. Boxed areas indicate the regions shown at higher magnification to the right. Scale bars: 20 μm (main panels); 5 μm (insets). (E) Immunofluorescence analysis of ZO-1 and Esama in Tg(kdrl:EGFP)s843 at 32 hpf showing a collapsed junction in the rasip 1ubs28 mutant. Scale bars: 5 μm. (F) Quantification of observed junctional phenotypes at 32 hpf. rasip1ubs28 mutants show a significant number of reticulated junctions and collapsed anastomotic rings compared with wild type (WT n=6 embryos, 53 analyzed rings; mutant n=8 embryos, 68 analyzed rings). P<0.0001 (χ2 test).

Autonomous requirement of Rasip1 during ISV formation. (A) Schematic showing transplantation of TMR-labeled donor wild-type (WT) cells into rasip1ubs28 mutant hosts with both donor and host cells expressing Pecam1-EGFP in endothelial cells. Time-lapse images of wild-type cells (red) in rasip1ubs28 mutant hosts showing that wild-type cells elongate and maintain junctional contacts (Movie 6). Double-headed arrows indicate the extent of the ISV between DA and DLAV. (B) Schematic showing transplantation of EGFP-labeled wild-type donor cells [Tg(flia:EGFP)y1] into rasip1 mutant host embryos [Tg(flia:Galff)ubs3; (UAS:UCHD-mRuby2)ubs20]. Immunofluorescence analysis of VE-cadherin in embryos at 32 hpf. Transplanted wild-type cells elongate and form multicellular tubes. Graph shows quantification of junctional coverage along the dorsal-ventral axis (ratio between the accumulated length of junctions to the length of the ISV) (analyzed WT donor segment n=20, host cell segment n=23). (C) Rescue by transient endothelial-specific rasip1 expression. Endothelial expression was achieved by DNA microinjection using a fli1a:Rasip1-p2a-tdTomato-CAAX construct or fli1a:tdTomato-CAAX as a control. Graph shows quantification of junctional coverage along the dorsal-ventral axis (analyzed ISVs in rasip1ubs28 mutant background n=17, rasip1 over-expression n=13). Scale bars: 20 μm. Analyzed by unpaired two-tailed Mann–Whitney test (***P<0.0001 in B, ***P<0.001 in C); error bars indicate s.d.

Protracted delays in lumen formation in rasip1 mutants. (A,B) Live images of Tg(kdrl:EGFP)s843; (gata1a:DsRed)sd2 embryos. (A) Still images of time-lapse movies starting at 30 hpf (Movies 7 and 8). (B) Tracking of individual unlumenized ISV during embryonic development (32 to 96 hpf). Scale bars: 20 μm. (C) Percentage of blood-carrying ISVs at 96 hpf (WT n=3 embryos, 28 analyzed ISVs, mutant n=5, 46). Analyzed by unpaired two-tailed Mann–Whitney test (*P<0.1); error bars indicate s.d.

Analysis of ectopic luminal pockets during DLAV formation in rasip1 mutants. (A) Still images of time-lapse movies showing the emergence of ectopic luminal pockets (yellow arrowheads) in rasip1 mutants (Movies 9 and 10). (B) Schematic of possible cellular localizations of ectopic lumens. To differentiate between these possibilities, two types of experiments were performed: microangiography (C) and colocalization of luminal pockets with junctional marker (D). (C) Visualization of ectopic lumens and patent lumens in a rasip1ubs28 embryo (36 hpf). Ectopic luminal pockets are indirectly visualized by the absence of cytoplasmic EGFP (yellow arrowheads) [Tg(kdrl:EGFP)s843]. The patent lumen is marked by microangiography using quantum dots in red (black in bottom panel). Ectopic lumens are not part of the patent vasculature. (D) Still images of time-lapse movies during lumen formation in the DLAV from around 32 hpf onward in wild-type (WT; top) and rasip1ubs28 (bottom) embryos (Movies 11-14). Endothelial cells are labeled with mRFP (grayscale images) and junctions are labeled by VE-cad-Venus (merged images). Yellow arrowheads indicate the ectopic luminal pockets in the rasip1 mutant. Scale bars: 5 μm.

Apical-to-junctional re-localization of Rasip1 during blood vessel fusion. (A-C) Immunofluorescence labeling of Rasip1 and VE-cadherin during different stages of DLAV formation (30-36 hpf). At 30 and 32 hpf Rasip1 does not localize to endothelial junctions (yellow arrowheads). At 32 hpf, Rasip1 is restricted to the apical surface of the anastomotic ring (yellow arrowheads). At 36 hpf, Rasip1 localizes to endothelial junctions (VE-cadherin, white arrowheads). Boxed areas indicate the regions shown at higher magnification below. Scale bars: 20 μm (top panels); 5 μm (insets).

Phenotypic comparison of radil-b single and of rasip1/radil-b double mutants suggests partially overlapping functions during vascular morphogenesis. (A) Immunofluorescence analysis of ZO-1 and VE-cadherin distribution in Tg(kdrl:EGFP)s843 at 32 hpf. The graph shows the percentage of DLAVs exhibiting a clear ring at 32 hpf. Number of embryos and junctions analyzed at 32 hpf: WT (5, 15), rasip1ubs28 (3, 11), radil-bsa20161 (3, 6) and double mutant (2, 3). (B) Live images at 48 hpf using Tg(ve-cad:ve-cadVENUS); Tg(fliep:gal4ff)ubs3; (UAS:mRFP) reporter lines. Scale bars: 20 µm. (C) Quantification of blood flow defects in ISVs at 48, 72 and 120 hpf in rasip1ubs28, radil-bsa20161 and in double mutants. radil-bsa20161 mutants show only transient defects in blood flow at 48 hpf. rasip1ubs28; radil-bsa20161 double mutants show a strongly enhanced phenotype. Number of embryos and ISVs analyzed at 48, 72 and 120 hpf, respectively: WT (4, 44; 5, 71; 6, 87), rasip1ubs28 (12, 176; 8, 119; 10, 118), radil-bsa20161 (9, 105; 8, 78; 5, 41) and double mutant (5, 56; 10, 102; 6, 55). Analyzed by unpaired two-tailed Mann–Whitney test (A,C) (NS, no significance; *P<0.1, **P<0.01, ***P<0.001, ****P<0.0001); error bars indicate s.d.

Loss of Ccm1 and Heg1 phenocopies aspects of rasip1 mutants. (A) Defects in cell rearrangements induced by loss of rasip1, ccm1 and heg1 function. Live images at 48 hpf using the Tg(fli1a:Pecam-EGFP)ncv27 reporter line. White and yellow arrows show the gaps between junctions. Scale bar: 20 µm. (B) Quantification of multicellular ISVs at 48 hpf [control (Ctrl) morpholino (MO)-injected embryos n=5, 24 analyzed ISVs; ccm1 MO n=4, 26; heg1 MO n=5, 23]. (C) Immunofluorescence analysis of control, ccm1 and heg1 morphants at 32 hpf. Transgenic Tg(kdrl:EGFP)s843 embryos were stained for VE-cadherin. Boxed areas indicate the regions shown at higher magnification below. Scale bars: 5 μm. (D) Immunofluorescence analysis of control, ccm1 and heg1 morphants using anti-VE-cadherin and anti-Rasip1 antibodies at 48 hpf. Scale bars: 2 µm. White arrowheads indicate colocalization of VE-cadherin and Rasip1. Yellow arrowheads indicate absence of Rasip1 from endothelial cell junctions. (E) Quantification of the relative intensity of Rasip1 localized at junctions compared with that on the apical membrane. Ratio=junctional Rasip1/apical Rasip1 referenced by VE-Cadherin (junction). Control-MO injected embryos display elevated junctional Rasip1 compared with the ccm1 and heg1 morphants (analyzed regions in control MO n=37; ccm1 MO n=54; heg1 MO n=62). Analyzed by unpaired two-tailed Mann–Whitney test (**P<0.01, ***P<0.001, ****P<0.0001); error bars indicate s.d.

Acknowledgments
This image is the copyrighted work of the attributed author or publisher, and ZFIN has permission only to display this image to its users. Additional permissions should be obtained from the applicable author or publisher of the image. Full text @ Development