
- Title
-
Opposite Effects of Two Human ATG10 Isoforms on Replication of a HCV Sub-genomic Replicon Are Mediated via Regulating Autophagy Flux in Zebrafish
- Authors
- Li, Y.C., Zhang, M.Q., Zhang, J.P.
- Source
- Full text @ Front Cell Infect Microbiol

A zebrafish model of liver-specific HCV sub-replicon. (A) Cartoon representation of the structures of the two HCV sub-replicon vectors. The HCV sub-replicon was composed of both vectors pmHNF-3N and pFLP-5B. pmHNF-rGC3N was constructed with a mouse HNF4a promoter sequence and a complementary cDNA sequence of gfp-IRES(EMCV)-core-5′UTR fused cDNA that was reversely inserted at the downstream of the mHNF promoter and followed by a sense HCV 3′UTR sequence. Vector pFLP-5BR was consisted with zebrafish liver-fab enhancer and human HL promoter sequence as the transcription regular elements, followed by HCV RNA polymerase cDNA (NS5B), IRES2 (EMCV), and RFP cDNA. (B) NS5B expression in the livers of zebrafish larvae injected with pFLP-5BR compared to uninjected wild type fish (WT). Four-days post fertilization larvae were detected using a white light, and fluorescent RFP filter (556 nm excitation, 586 nm emission) under a fluorescence microscopy. (C) Fluorescence image of a live zebrafish larva at 4 days post fertilization (dpf) showing liver-targeted expression of the HCV subreplicon. Photos taken under a fluorescence microscopy using a GFP filter (480 nm excitation, 505 nm emission) and a RFP filter (556 nm excitation, 586 nm emission). Green fluorescence indicates the HCV core protein and red fluorescence indicates the HCV NS5B protein. (D) Whole mount in situ hybridization was used to detect the HCV subgenome model. The probe core- (HCV core antisense RNA) identified the sense strand of HCV core RNA, representing a relative replication level of the HCV subreplicon; the core+ probe (HCV core sense RNA) identified the antisense strand of core RNA, representing a relative transcription level of the HCV subreplicon directed by the mHNF4a promoter; the ns5b+ probe identified antisense strand of ns5b RNA (as a negative control); the ns5b- probe identified sense strand of ns5b RNA transcribed by hHL promoter. Scale bars in D represent 150 μm. (E) RT-PCR for the HCV core+ replication and NS5B transcription in the HCV sub-replicon. core+, the sense strand of HCV core RNA, representing products of the HCV subreplicon replication. ns5b, ns5b transcription level. β-actin was used as a loading control. WT, wild type; both pmHNF-3N and pFLP-5B larvae were used as two negative controls for the HCV model, respectively. (F) Western blotting confirmed that NS5B protein was produced only in the larvae injected with the HCV model plasmids (co-injection of pmHNF-3N and pFLP-5B) and with NS5B expression vector. |
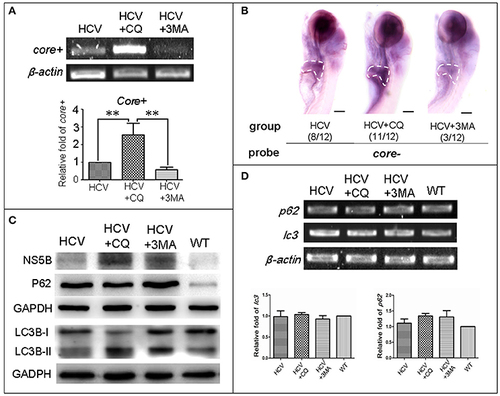
Autophagy affects the replication ability of the HCV subreplicon model. (A) RT-PCR test was used for quantification of the core+ level in unexposed HCV model larvae (HCV), HCV model larvae exposed to either CQ (50 μM) or 3-MA (5 mM). β-actin was used as a sample loading control. Histogram shows relative core+/β-actin ratios from three independent experiments. Data are expressed as means ± SD. **p < 0.01. (B) Whole Mount in situ Hybridization (WISH) indicate that the strongest core+ signal is in HCV model larvae exposed to CQ, the second one in the unexposed HCV model larvae and the lowest in the HCV model larvae exposed to 3-MA. The fraction numbers in brackets show the positive number and the total number of larvae being observed in the three groups. Scale bars represent 150 μm. (C) Western blot showing the protein levels of HCV-NS5B and autophagy flux marker P62 and LC3B-II/I in the unexposed HCV model larvae (HCV), the HCV model larvae exposed to either CQ (50 μM) (HCV+CQ) or 3-MA (5 mM) (HCV+3MA), and wild type larvae (WT). GADPH was used as a sample loading control. (D) Transcription levels of p62 and lc3b genes were detected via RT-PCR tests, and were not significantly different across the four groups of larvae. All larvae were 8-dpf. |
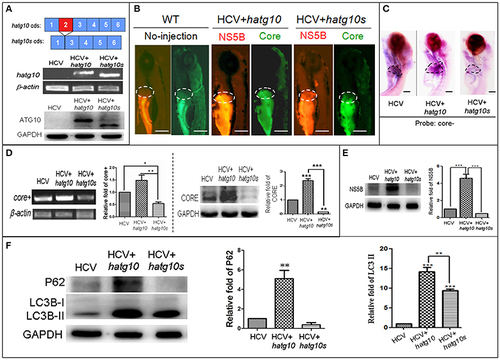
Different effects of two human autophagy related ATG10 and ATG10S on the HCV subgenomic replication and on autophagy flux in zebrafish larvae. (A) Diagrams show the coding regions of both transcripts of the human atg10 gene exons (upper panel). The HCV model larvae were injected either hATG10 expression vector or hATG10S expression vector separately at 1–4 cell stage and collected at 8 dpf for RT-PCR (middle panel) and western blotting (lower panel) detection. The results identified expression of hATG10 and hATG10S in the HCV subreplicon model zebrafish larvae. (B) Living fluorescence imaging shows variable level of the HCV subreplicon in liver of 5 dpf larvae affected by the two hATG10 isoforms. The green fluorescence represents HCV-core protein and the red fluorescence for HCV NS5B protein. Scale bars represent 280 μm. (C) WISH was used to detect the replication level of the HCV subreplicon by antisense HCV-core RNA probe (core-) in the three groups of no-ATG10 injected HCV model larvae (HCV), hatg10-injected HCV model larvae (HCV+hatg10) and hatg10s-injected HCV model larvae (HCV+hatg10s). The scales represent 150 μm. (D) RT-PCR (left panel) and western blotting (right panel) tests indicate the levels of HCV-core+ RNA and CORE protein changed differentially by hATG10 and hATG10S in the HCV model larvae, as compared to the no-ATG10 injected model larvae (8 dpf). β-actin and GAPDH were used as sample loading controls. The histograms show relative core+/β-actin ratios and CORE/GAPDH ratios, respectively, from three independent tests. Data are expressed as means ± SD. *p < 0.05, **p < 0.01. (E) Western blotting results show the level of HCV NS5B protein regulated differentially by ATG10 and ATG10S in the HCV model larvae, as compared to the no-ATG10 injected model larvae (8 dpf). GADPH was used as a loading control. The histogram shows relative NS5B/GAPDH ratios from three independent tests. Data are expressed as means ± SD. ***p < 0.001. (F) Western blotting results show the levels of LC3B-II/I and p62 proteins being regulated differentially by ATG10 and ATG10S in the HCV model larvae, as compared to the no-ATG10 injected model larvae (8 dpf). GADPH was used as a loading control. The histograms show relative LC3-II/GADPH and P62/GADPH ratios from three independent experiments. Data are expressed as means ± SD. **p < 0.01, ***p < 0.001. |