
Fig. 3
- ID
- ZDB-FIG-180712-61
- Publication
- Li et al., 2018 - Opposite Effects of Two Human ATG10 Isoforms on Replication of a HCV Sub-genomic Replicon Are Mediated via Regulating Autophagy Flux in Zebrafish
- Other Figures
- All Figure Page
- Back to All Figure Page
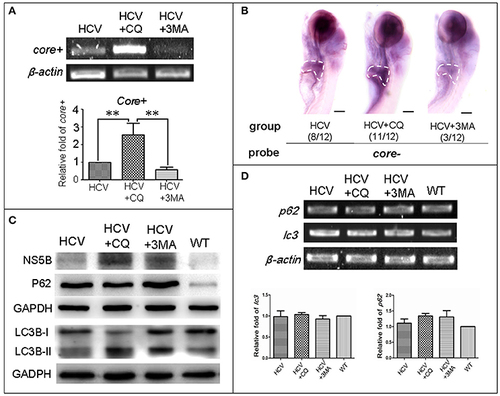
Autophagy affects the replication ability of the HCV subreplicon model. (A) RT-PCR test was used for quantification of the core+ level in unexposed HCV model larvae (HCV), HCV model larvae exposed to either CQ (50 μM) or 3-MA (5 mM). β-actin was used as a sample loading control. Histogram shows relative core+/β-actin ratios from three independent experiments. Data are expressed as means ± SD. **p < 0.01. (B) Whole Mount in situ Hybridization (WISH) indicate that the strongest core+ signal is in HCV model larvae exposed to CQ, the second one in the unexposed HCV model larvae and the lowest in the HCV model larvae exposed to 3-MA. The fraction numbers in brackets show the positive number and the total number of larvae being observed in the three groups. Scale bars represent 150 μm. (C) Western blot showing the protein levels of HCV-NS5B and autophagy flux marker P62 and LC3B-II/I in the unexposed HCV model larvae (HCV), the HCV model larvae exposed to either CQ (50 μM) (HCV+CQ) or 3-MA (5 mM) (HCV+3MA), and wild type larvae (WT). GADPH was used as a sample loading control. (D) Transcription levels of p62 and lc3b genes were detected via RT-PCR tests, and were not significantly different across the four groups of larvae. All larvae were 8-dpf. |