FIGURE SUMMARY
Title

Orientation-Selective Retinal Circuits in Vertebrates

Authors
Antinucci, P., Hindges, R.
Source
Full text @ Front. Neural Circuits

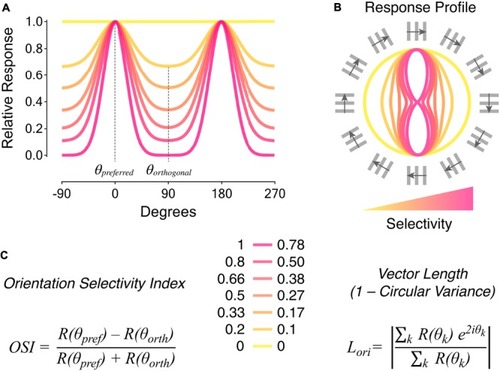
Metrics to quantify orientation selectivity in neural responses. (A) Tuning curves of neural responses to oriented visual stimuli. The color coding indicates different levels of orientation selectivity, from low (yellow) to high (magenta). The preferred orientation angle (𝜃preferred) corresponds to the angle of the stimulus eliciting maximal responses. The orthogonal orientation angle (𝜃orthogonal) corresponds to angles of stimuli oriented ± 90° relative to the preferred orientation angle. (B) Response profiles to oriented visual stimuli corresponding to the tuning curves represented in (A). The orientation and direction of movement of square-wave gratings with 30° angular distance steps are indicated around. (C) Metrics typically used to quantify orientation selectivity in neural responses: orientation selectivity index (OSI; left), and vector length in orientation space (Lori also known as 1 – circular variance; right). Quantification of orientation selectivity for the responses in (A,B) is reported in the middle. Note that the two metrics have different sensitivities to tuned firing. The OSI consists in the difference between responses to preferred, R(𝜃pref), and orthogonal, R(𝜃orth), stimuli divided by their sum. On the other hand, Lori takes as input responses to all orientation angles, R(𝜃k), in order to calculate the mean vector length in orientation space (k ranges from 0° to 180°). See Mazurek et al. (2014) for detailed descriptions and comparisons of the two metrics.

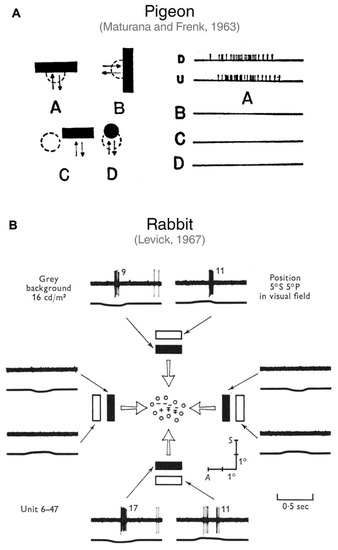
First studies describing orientation-selective ganglion cells in vertebrate retinae. (A) Discovery of horizontally tuned OSGCs in the pigeon retina by Maturana and Frenk (1963). In A (right side), the firing of a pigeon OSGC in response to a horizontal bar moving downward (D) or upward (U) is represented. As shown in B, C and D, the same cell does not respond to a vertically oriented bar moving leftward or rightward (B), nor to a horizontal bar presented over the receptive field surround (C), or to a small spot moving over the receptive field center (D). Image taken from Maturana and Frenk (1963) with permission. (B) Characterization of OSGCs in the rabbit retina by Levick (1967). Spiking responses of an OSGC to light or dark bars with different orientations moving across the receptive field center. The mapping of the receptive field center is also represented at the center of the schematic. The ‘+’ symbol indicates responses to a stationary spot at light ON; ‘–’, at light OFF; ‘ ± ’, at both light ON and OFF; ‘o’, no response detected. The traces show the spiking responses elicited by the bars (upper trace; number of spikes is reported after each response) and the output of a photomultiplier focused on the receptive field (lower trace; an upward deflection indicates light increase). Note that only horizontally oriented bars elicited responses. A, Anterior; S, superior. Image taken from Levick (1967) with permission.

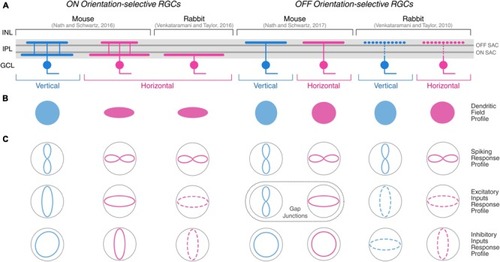
Morphological and physiological features of orientation-selective retinal ganglion cells in mouse and rabbit. Schematic summarizing the morphological (A,B) and physiological (C) properties of ON and OFF OSGCs in mouse (Nath and Schwartz, 2016, 2017) and rabbit (Venkataramani and Taylor, 2010, 2016). Dendritic stratification (A) in the inner plexiform layer (IPL), and planar dendritic field profiles (B) of OSGCs are displayed. Dark gray lines in the IPL indicate ON and OFF choline acetyltransferase (ChAT)-labeled strata corresponding to ON and OFF starburst amacrine cell (SAC) neurites, respectively. The IPL dendritic stratification of rabbit OFF OSGCs is represented with dashed lines because it was not explicitly described by Venkataramani and Taylor (2010), but other studies have reported both mono- and bistratified OFF OSGCs in rabbit (see Table 1). (C) Response profiles of OSGC spiking (top), excitatory inputs (middle), and inhibitory inputs (bottom). Dashed lines of excitatory and inhibitory inputs response profiles in rabbit OSGCs indicate estimated profiles from responses recorded only during preferred and orthogonal orientation stimulation. In mouse OFF OSGCs, the tuned response profiles of gap junction-mediated electrical inputs are indicated (dashed box) instead of excitatory inputs from chemical synapses. INL, inner nuclear layer; GCL, ganglion cell layer. Diagram modified and expanded from Antinucci et al. (2016a) with permission.

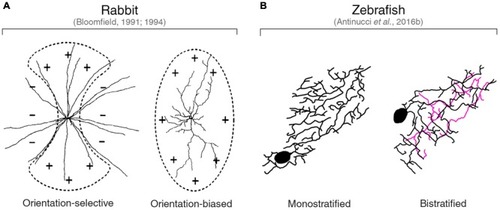
Orientation-tuned amacrine cells in rabbit and zebrafish. (A) Planar dendritic morphology of the two classes of orientation-tuned amacrine cells found in the rabbit retina by Bloomfield (1991, 1994). ‘Orientation-selective’ amacrine cells have a circular dendritic field (left). ‘Orientation-biased’ amacrine cells are characterized by a highly elongated dendritic field (right). Schematic representations of the corresponding receptive fields are overlaid on top of the dendritic arbors. ‘+’ and ‘–’ symbols indicate excitatory and inhibitory inputs, respectively. Images taken from Bloomfield (1994) with permission. (B) Planar dendritic morphology of the two types of orientation-tuned amacrine cells found in the larval zebrafish retina by Antinucci et al. (2016b). Note the high degree of dendritic elongation similar to that observed in rabbit ‘orientation-biased’ amacrine cells. The color coding of neurites indicates the different IPL laminae they are located. Black and magenta lines indicate neurites in OFF and ON laminae, respectively. Images taken from Antinucci et al. (2016b) with permission.

Working models of orientation-selective retinal circuits in vertebrate retinae. (A) Proposed circuit diagrams underlying the firing selectivity of different OSGC types in rabbit (left), mouse (middle), and zebrafish (right). Photoreceptors are represented in yellow; bipolar cells (BCs) in green; amacrine cells (ACs) in blue; and ganglion cells (GCs) in red. Cell numbering is used to relate each cell type with the corresponding tuning profile shown in (B) below. Excitatory synapses are indicated by ‘+’ symbols (full circles), whereas inhibitory synapses are indicated by ‘–’ (empty circles). Electrical synapses between mouse OFF orientation-selective amacrine cells (AC1) and OFF OSGCs are indicated by the jagged line. Potential but speculative connectivity between AC1 and BC terminals in larval zebrafish is represented by the dashed blue line. (B) Response profiles of the cell types represented in A to oriented visual stimuli. ‘+’ and ‘–’ symbols indicate along which axes excitatory (+, green) and inhibitory (–, blue) inputs contribute to the tuning of each cell type. The neurotransmitter identities of the various amacrine cell types are also reported (question marks indicate predicted neurotransmitter identities). GABA, gamma-aminobutyric acid. Tonic inputs are specified in small gray writings. Unless specifically indicated in small gray writings, the response polarity of the various cell types is the same as that of the respective downstream OSGC. In rabbit and zebrafish circuits, orientation selectivity is proposed to originate from orientation-selective GABAergic amacrine cells (AC1), which subsequently generate tuned responses in downstream amacrine, bipolar and/or ganglion cells through inhibitory synapses. In the mouse OFF circuit, AC1 amacrine cells convey orientation selectivity to OFF OSGCs by electrical coupling through gap junctions. Rabbit ON horizontal OSGCs possess two horizontally oriented flanking subfields generated by tonically active amacrine cells (AC3), which are predicted to invert the ON pathway signal by disinhibiting center bipolar cells (BC1) and, therefore, render negative contrast stimuli in the flanking subfields excitatory (dashed box).

Acknowledgments
This image is the copyrighted work of the attributed author or publisher, and ZFIN has permission only to display this image to its users. Additional permissions should be obtained from the applicable author or publisher of the image. Full text @ Front. Neural Circuits