
- Title
-
Ancestral Circuits for the Coordinated Modulation of Brain State
- Authors
- Lovett-Barron, M., Andalman, A.S., Allen, W.E., Vesuna, S., Kauvar, I., Burns, V.M., Deisseroth, K.
- Source
- Full text @ Cell

Variability in Sensorimotor Reaction Time Reflects the Internal State of Alertness in Larval Zebrafish (A) Schematic of behavioral apparatus and example data. Tethered zebrafish are presented with a looming dot stimulus, and tail movements are recorded with an infrared (IR) camera. (Right) Trials in an example fish. Black dots indicate escape onset. (B) Histogram of RTs for an example fish. (C) Schematic of combined behavior and heart-rate monitoring with two-photon cardiac imaging in Tg(cmlc2:GFP) fish. (Right) Example two-photon images of GFP+ heart when dilated and constricted (each image is an average of six frames). White brackets indicate ventricle cross section. (D) Example of heart-rate time series together with behavior across two trials. (E) Summary data, n = 6. See Figure S1A for individual fish example. Solid line: linear regression; shaded region: 95% confidence interval. See also Figure S1. |

Whole-Brain Cellular-Resolution Registration of Activity and Molecular Features with MultiMAP (A) Schematic of sample-handling pipeline. (B) Schematic of data-handling pipeline. (C) Orthogonal planes (XY, YZ, and XZ) and x,y zoom of signal overlays from a single fish. White lines indicate location of cross section. The cell types at bottom right are the cholinergic tegmentum (cyan), the serotonergic dorsal raphe nucleus (red), and the noradrenergic locus coeruleus (yellow). Scale bars: 100 μm (left) and 25 μm (right). See Figure S2 and Movie S1 for additional details and examples. (D) Spinal projection neurons (SPNs) in Tg(elavl3:H2B-GCaMP6s) fish are back-labeled through injection of Texas Red Dextran. Scale bar: 50 μm. (E) Schematic of data-handling pipeline, where GCaMP volumes are used for registration, and co-imaged SPN volumes are used to assess accuracy. (F) Z-projections through the midbrain and hindbrain of live (red) and fixed (cyan) SPN samples are overlaid before (top) or after (bottom) registration of GCaMP volumes. Scale bar: 50 μm. (G) Mean distance between matched cell centers (STAR Methods) before and after registration. Bars are mean ± SEM. Two-tailed Wilcoxon signed-rank test, n = 4 fish. ∗∗∗p < 0.001. See also Figure S2, Movie S1, and STAR Methods. |
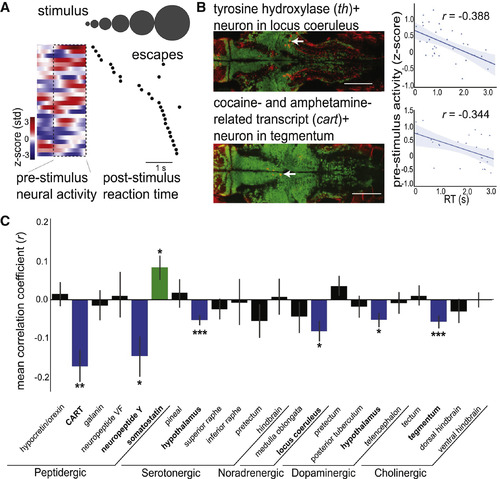
Diverse Neuromodulatory Cell Types Are Correlated with Alertness States (A) Example cart+ tegmentum neuron, with pre-stimulus time series and onset to first escape-like tail movement for each trial (black dots), ordered by RT. (B) Example data from individual th+ locus coeruleus neuron (top) and cart+ tegmentum neuron (bottom). (Left) Overlays of antibody label (red) with live GCaMP (green) in example Z plane after volume registration (neurons identified with white arrow). Scale bars: 100 μm. (Right) Scatterplot of mean pre-stimulus neural activity and RT. Solid line: linear regression; shaded region: 95% confidence interval. (C) Summary data from 22 neuromodulatory cell types, displaying correlation coefficients from comparison of RT and pre-stimulus neural activity. Bars are mean ± SEM, n = 34 fish. Significance values are determined by one-sample Wilcoxon signed-rank tests and false discovery rate correction for multiple comparisons. Groups are colored according to their correlations: blue (negative correlation), green (positive correlation), or black (no correlation). See Figure S3 for details and examples of each cell type and Figure S4 for additional functional characterization. ∗p < 0.05, ∗∗p < 0.01, ∗∗∗p < 0.001. |
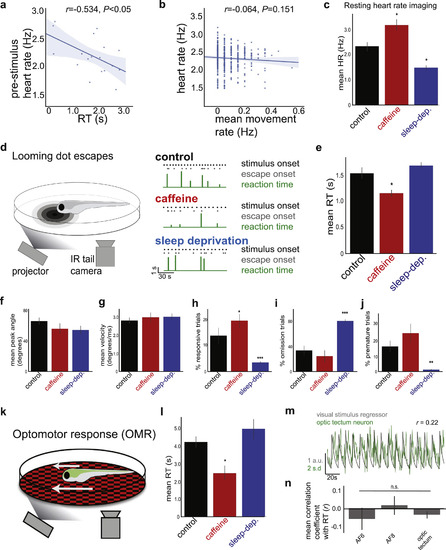
Reaction Time Is a Measure of Internally Generated Alertness States, Related to Figure 1 (A) Correlation between pre-stimulus heart rate and RT in an example fish (r = −0.534, p < 0.05). Heart rate tends to be higher before fast RTs (high alertness) and tends to be lower before slow RTs (low alertness). See Figure 1E for summary data. Solid line = linear regression; shaded region = 95% confidence interval. (B) Summary data, showing no significant correlation between heart rate and total movement rate in 20 s bins (r = −0.064, p > 0.05, n = 6). (C) Effects of caffeine and sleep deprivation on resting heart rate, imaged in fully embedded fish. n = 6, 4, and 4 (control, caffeine, and sleep-deprivation, respectively). One-way ANOVA, F(2,13) = 16.41, p < 0.001. Two-sided t tests with control, ∗p < 0.05. (D) Left: Schematic of zebrafish looming dot RT behavior. Right: Example behavioral recordings over 2 minutes. Each fish is either control (no treatment), treated with 50 mg/L caffeine, or subjected to one night of sleep deprivation. Note that control fish display variability in RTs, whereas fish with potentiated alertness (caffeine) have faster RTs and fish with suppressed alertness (sleep deprivation) have slower RTs. (E) Summary data for control fish (n = 16, black), fish treated with 50 mg/L caffeine (n = 8, red), and fish deprived of sleep for one night (n = 10, blue). Mean ± SEM. Kruskal-Wallis test, H = 10.67, p < 0.005, Mann-Whitney rank tests with control. ∗p < 0.05. (F–J) Data from the same fish in panel e. All data are mean ± SEM. (F) Summary data for peak tail angle. Kruskal-Wallis test, H = 3.75, p > 0.05. (G) Summary data for peak tail velocity. Kruskal-Wallis test, H = 1.30, p > 0.05. (H) Summary data for % responsive trials. Kruskal-Wallis test, H = 20.46, p < 0.001. Mann-Whitney rank tests with control. ∗p < 0.05, ∗∗∗p < 0.001. (I) Summary data for % omitted trials. Kruskal-Wallis test, H = 17.95, p < 0.001. Mann-Whitney rank tests with control, ∗∗∗p < 0.001. (J) Summary data for % premature response trials. Kruskal-Wallis test, H = 14.88, p < 0.001. Mann-Whitney rank tests with control, ∗∗p < 0.01. Caffeine does not significantly increase the premature response rate. (K) Schematic of zebrafish optomotor response (OMR) behavior. (L) Summary data. Mean ± SEM. Kruskal-Wallis test, H = 7.56, p < 0.05, Mann-Whitney rank tests with control. ∗p < 0.05. (M and N) Visual stimulus-correlated neurons in looming-related sensory regions do not show stimulus responses correlated to RT. (M) Example neuron correlated to visual stimulus regressor, recorded with 2-photon imaging (STAR Methods). (N) Summary data for visual-correlated neurons in each looming-associated visual region (AF: retinal arborization field). n = 12, 23, and 217 cells (left to right). Significance values determined by one-sample Wilcoxon signed-rank tests and false discovery rate correction for multiple comparisons. Mean ± SEM. All summary data are grouped by fish. |

Additional Details of MultiMAP and Compatibility with In Situ Hybridization, Related to Figure 2 (A) For general user reference: commands used for volume registration in CMTK (STAR Methods). (B) 16 z-planes extracted from tissue volumes, from a single example fish. Live GCaMP (green) and fixed GCaMP after registration (red); yellow indicates overlap. Each plane corresponds to z-plane in live volume that was imaged during behavior. (C) 16 z-planes extracted from tissue volumes, in same example fish as panel b. Live GCaMP (green) and Z-brain atlas Tg(elavl3:H2B-RFP) reference after registration (red). (D) Protocol for annotation of live-recorded cells with neurochemical and anatomical information, with example for TH+ cells in the locus coeruleus (LC). To distinguish between antibody labeling of cell bodies versus axonal and dendritic projections, cell bodies were manually identified. For each ROI identified from live-imaged z-plane, the ROI is assigned to a given neuromodulatory region if 75% of the pixels within that ROI overlap with the antibody cell body label, and 100% of the pixels within that ROI overlap with the anatomical region label(s). In the example image, TH+ LC neurons are labeled in red, whereas TH+ cells that do not overlap with the LC anatomical mask are labeled in blue. Scale bars: 100 μm. (E) Higher magnification images of example brains, showing cellular-resolution of registration approach, even in densely packed tissue. Scale bars: 30 μm. (F) Demonstration of registration method compatibility with fluorescent in situ hybridization (fISH). Here we show registration in the hypothalamus, even after the harsh treatment of fISH. We used the hybridization chain reaction method (STAR Methods), which allows for multiplexed molecular labeling with orthogonal fluorophores. Detection of RNA over protein is particularly useful for neuropeptides such as hypocretin/orexin (hcrt, used here), where the protein is primarily localized to axonal terminals. Scale bars: 50 μm and 5 μm (inset). |

Anatomical and Functional Details of the 22 Neuromodulatory Cell Types Imaged in Zebrafish, Related to Figures 3 and 4 From left: name of neuromodulatory group and number of fish and cells analyzed, list of Z-brain masks to identify anatomical location of cells (out of 294), overlay of GCaMP6s and antibody in example z-plane (neurons location denoted with white arrow), RT-neural activity scatterplot from an example neuron, and the distribution of correlation coefficients for all neurons recorded. |
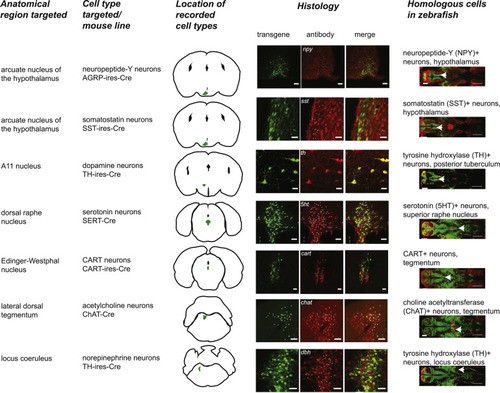
Anatomical and Targeting Details of the Seven Neuromodulatory Groups Tested in Mice, Related to Figures 5 and 6 From left: name of anatomical region targeted, name of cell type targeted and Cre line used, schematic of recording location (GCaMP-expressing region shaded in green), co-labeling of antibody label with GCaMP, ChR2-eYFP, or eNpHR3.0-eYFP expression (matching cells denoted by white dots), and homologous neuromodulatory group in larval zebrafish (from Figure S3 and STAR Methods). Scale bars: 50 μm (arcuate nucleus - npy), 20 μm (arcuate nucleus - sst), 20 μm (A11), 50 μm (dorsal raphe), 50 μm (Edinger-Westphal nucleus), 50 μm (locus coeruleus), 100 μm (lateral dorsal tegmentum), 100 μm (zebrafish images). |
Reprinted from Cell, 171(6), Lovett-Barron, M., Andalman, A.S., Allen, W.E., Vesuna, S., Kauvar, I., Burns, V.M., Deisseroth, K., Ancestral Circuits for the Coordinated Modulation of Brain State, 1411-1423.e17, Copyright (2017) with permission from Elsevier. Full text @ Cell