
- Title
-
Myosin-1 inhibition by PClP affects membrane shape, cortical actin distribution and lipid droplet dynamics in early Zebrafish embryos
- Authors
- Gupta, P., Martin, R., Knölker, H.J., Nihalani, D., Kumar Sinha, D.
- Source
- Full text @ PLoS One

Inhibition of Myo1 arrests cell division and affected blastomere shapeof Zebrafish embryos. Schematic representation of Myo1 domain structures. (A) Semiquantitative RT-PCR profiles from cDNA and RNA templates. For Myo1Ea&b, control (top panel) and with PClP (bottom panel), were compared at 1–4 and 64 cells stages for cDNA and RNA templates, (B) Semiquantitative RT-PCR profiles from cDNA and RNA templates. For Myo1Cb, control (top panel) and with PClP (bottom panel), were compared at 1–4 and 64 cells for cDNA and RNA templates. (C) (i) Western blot for Myo1C relative-levels at 1–4 and 64 cell stages. Control (top panel) and with PClP (bottom panel), GAPDH used as loading control. (ii) Relative change in levels of Myo1C ±PClP, 1–4 and 64 cell stages, control grey, PClP black. Error bars indicate SD, n = 3. (D) (i) Top panel, control embryos at different developmental stages. Bottom panel, PClP treated embryos taken in identical time as in control, dotted line shows boundary between yolk and blastodisc in both panels, (ii) measurement of changes in blastodisk thickness, as indicated by vertical both sided arrows in(Ei) with time, approximately along first cleavage furrow in both, the control (dotted line) and PClP treated embryos (solid line), n = 8, error indicate SD. Black arrow-head in time axis indicates PClP addition. Embryos were observed in lateral or side view position. (E) DAPI stained nucleus profile of 64-cell control (2 hpf) (top panel) and equivalent 2 hpf PClP inhibited 8- cell embryo (middle panel). 1 hpf control 8- cell embryo, showing divided nucleus is also shown (lower panel). bar 120μm in all places. |

Comparison between role of Myo2 and Myo1, in furrow formation and LD dynamics. (A) Sideview, time-lapse profile of furrow maturation in control (top panel), Blebbistatin treated/Myo2 inhibited (middle panel) and PClP treated/Myo1 inhibited embryos (bottom panel). White dashed arrows in top panel and bottom panel indicate the formation of third furrow (marked as 3), parallel to the first furrow (marked as 1). Filled white arrows in bottom panel indicate the dissolving first-furrow and LD accumulation at that site, in Myo1 inhibited embryo. Filled white arrow in middle panel indicates dis-localization of second and third furrow. Bar 100 μm. (B) Top-view time-lapse profile of furrow maturation in control (top panel), Myo2 inhibited (middle panel) and Myo1 inhibited embryos (bottom panel). Arrows in bottom panel indicate LD accumulation along dissolving first furrow in Myo1 inhibited embryo. Bar 50 μm. (C) Cartoon diagram of embryo with (i) top and (ii) sideview position shown by eye symbol. (D) Scanning electron microscopy showing embryo blastomere surface of 64 cell control (top panel), equivalent time Myo2 inhibited (middle panel) and equivalent time Myo1 inhibited embryo (bottom panel). Bar 100 μM. |
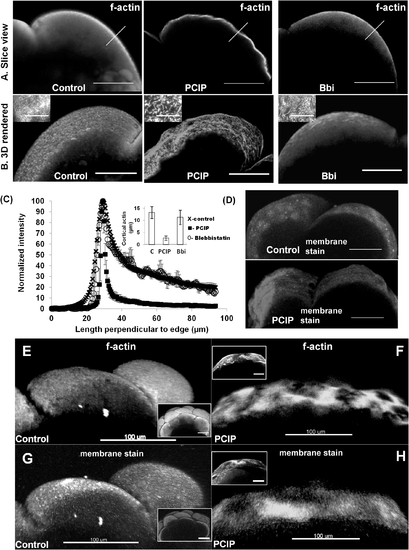
Reorganization of blastomeric cortical actin and membrane upon MyoI inhibition by PClP. (A) Slice views- Cortical actin distribution profile in control (carrier DMSO treated) 1hpf (left panel), PClP treated 1 hpf (middle panel) and blebbistatin treated 1 hpf embryo (right panel). (B) 3D rendered in 100 μm cross section of embryos- Cortical actin distribution profile in control 1hpf (left panel), PClP treated 1 hpf (middle panel) and blebbistatin treated 1 hpf embryos (right panel). Insets, zoomed in view by TIRF imaging. (C) Normalized actin (phalloidin-488) intensity profile perpendicular (along arrows in (A)), to the surface in control (cross), PClP (box) and blebbistatin (circle) treated embryos. Inset- comparison of cortical actin thickness measured by FWHM (n = 5 embryo each, error bars indicate standard deviation), along the line as indicated in Fig 3A. (D) 3D rendered in 100 μm cross section of embryos- Menbrane surface is stained with cell mask plasma membrane dye, control 1 hpf (top panel) and PClP treated 1hpf (bottom panel). (E-H) 3D rendered in 100 μm cross section of embryos. (E) Cortical actin distribution by phalloidin-alexa-488 staining in control embryo, 2 hpf. Inset- full blastomere. (F) Cortical actin distribution in 2 hpf Myo1 inhibited embryo by PClP, phalloidin-alexa-488 staining. Inset- full blastomere. (G) Membrane surface is stained with cell mask plasma membrane dye in control 2 hpf embryo. Inset- full blastomere. (H) Membrane surface is stained with cell mask plasma membrane dye in 2 hpf Myo1 inhibited embryo by PClP. Inset- full blastomere. Scale bars are 100μm everywhere in this figure except 5 μm in zoomed inset of (A&B). |
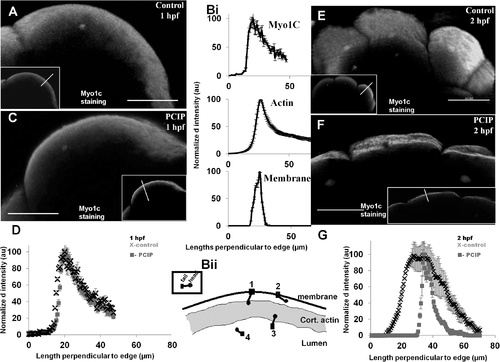
Redistribution of blastomeric Myo1C upon MyoI inhibition by PClP. (A) 3D rendered 100 μm cross section of Myo1C immunostaining profile in control 1 hpf embryo (inset- single confocal slice) (Bi) Normalized immunostaining intensity along the line drawn in Fig 4A inset, n = 5 embryos (Bi, top panel). Actin distribution at the same time, redrawn from Fig 3A, left panel, n = 5 (Bi, middle panel). Membrane distribution profile perpendicular to surface of embryo shown in Fig 3D, control)\, (Bi, bottom panel). (Bii) cartoon representation of Myo1C distribution in blastodisc cortex. (C) 3D rendered in 100 μm cross section of Myo1C immunostaining profile in 30 min PClP treated 1 hpf embryo, inset single confocal slice. (D) Comparative normalized intensity calculated long lines drawn in insets of (A&C)-slice views, control-cross, Myo1 inhibited-box, n = 5,. (E) Myo1C profiles for control 2 hpf, (F) Myo1 inhibited 2 hpf and (G) Normalized immunostaining intensity long lines drawn in insets of (E&F)-slice views, control (cross), Myo1 inhibited (box), n = 5, error bar indicates -standard deviation everywhere in Fig 4. |
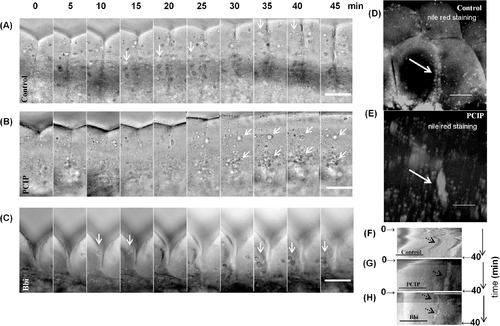
LDs gradually accumulate at the cleavage furrow of PClP treated embryo. (A-C) Lateral views of embryo, as observed in Fig 2A, Zoomed in on first cleavage furrow, (A) Control embryo from approximately 40 min post fertilization, montage of every 5 min, arrows indicates LDs near the first cleavage furrow. (B) Myo1 inhibited embryo from approximately 40 min post fertilization, montage of every 5 min. Arrows indicate accumulation of LDs at the first cleavage furrow line. (C) Myo2 inhibited embryo from approximately 40 min post fertilization, montage of every 5 min. Arrows indicate LDs near the first cleavage furrow. (D) Nile red staining of first cleavage furrow with lipid droplets shown by arrow in control embryo. (E) Nile red staining of first cleavage furrow with lipid droplet clump shown by arrow in Myo1 inhibited embryo. (F) Control, (G) Myo1 inhibited and (H) Myo2 inhibited embryos, kymograph view of average intensity along 10 μm line on both sides of the first cleavage furrow, ~ for approximately 40 min as shown in panels 5A-5C. Time is indicated along vertical axis and correlates with images in panel (5A-5C), approximate location of start and finish of 40 min time in kymographs are marked by arrows. LDs are indicated by black arrowheads. Scale bars are 50 μm in all images of this figure. |
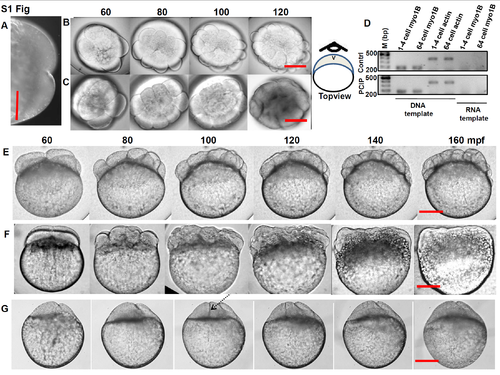
(A) Example of a two cell stage embryo, where drug was added. (B-C) Difference in cell division arrest phenotype, top-view position for (B) control by (C) 2.5 μM PClP. (D-F) Difference in cell division arrest phenotype, lateral view, extended time for (D) control by (E) 100μM blebbistatin and (F) 2.5 μM PClP. Bar 100 uM. |

Time course of complete regression of cleavage furrow when 100 μM blebbistatin was added at the one cell stage (two experiments), top-view. Bar 50 μm. |
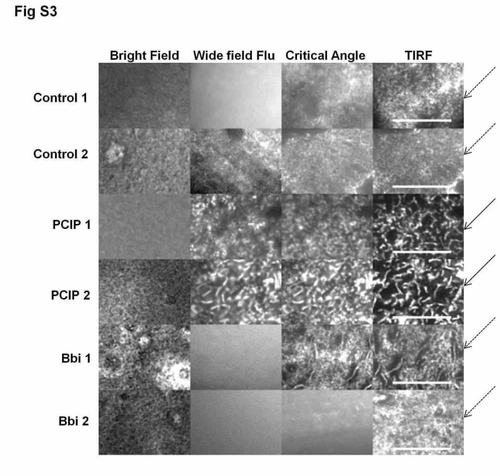
Cortical actin profile by TIRF of two embryos each, for control, PClP/Myo1 inhibition and blebbistatin treatment/Myo2 inhibition (at 1 hpf/30min treatment for either drug). Actin appears mainly as dense sheet like structure in control and Myo2 inhibited treated embryos, but appeared tubular in Myo1 inhibited embryos (arrows). (bar 5 μm). |

Zebrafish embryo, stained with Myo1C primary and secondary antibody showed cortical staining, whereas only secondary antibody showed yolk and background staining. Bar 100 nm. |

LDs at the first cleavage furrow of (A-B) Control 8 cell, (C) 2 hpf Myo1 inhibited 8 cell-sideview, (D) 2 hpf Myo1 inhibited 8 cell-topview. |
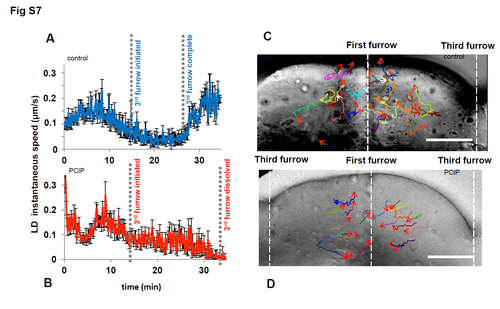
(A) Average instantaneous speed of LDs in control for 30 min in the dotted region as in S6A Fig, encompassing 3rd furrow formation (B) Average instantaneous speed of LDs in Myo1 inhibited embryo for 30 min in the same region, encompassing 3rd furrow formation. Average of 180 LDs taken from data sets of S5 and S6 Movies, error bars- standard-error. (C) Control (arrows) and (D) Myo1 inhibited (arrows) LD tracks of S5 Movie and A&B panels above, 0–10 mins, vertical lines indicate cleavage furrows, bar 50μm. |