
- Title
-
RETRACTED: Chemical inhibition reveals differential requirements of signaling pathways in krasV12- and Myc-induced liver tumors in transgenic zebrafish.
- Authors
- Yan, C., Yang, Q., Huo, X., Li, H., Zhou, L., Gong, Z.
- Source
- Full text @ Sci. Rep.
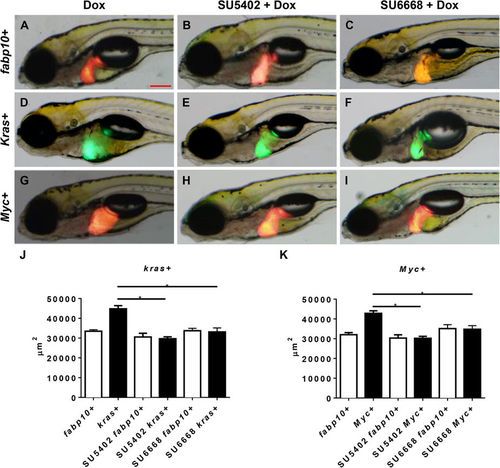
Effect of inhibition of VEGF/FGF on krasV12- and Myc-induced liver enlargement. 7?dpf fabp10+, kras+ or Myc+ larvae were treated with either 1??M SU5402 or 1??M SU6668 in the presence of 10??g/ml Dox and 2D liver size was measured based on images. (A?C) Representative images of 7?dpf fabp10+ control larvae. (D?F) Representative images of 7?dpf kras+ larvae. (G?I) Representative images of 7?dpf Myc+ larvae. (J) Quantification of liver sizes for kras+ larvae (K) Quantification of liver sizes for Myc+ larvae. N?=?20 from each groups; statistical significance: *p?<?0.05, Scale bar?=?20??m. |
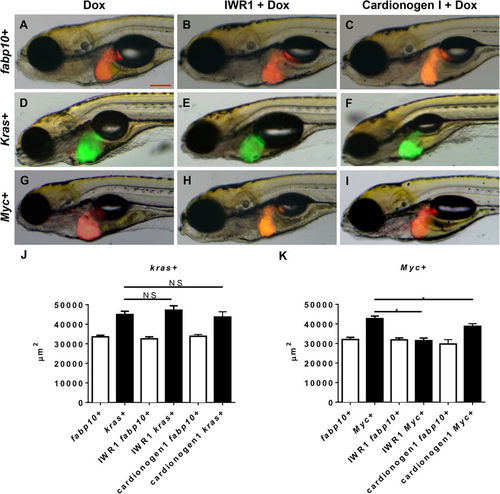
Effect of inhibition of Wnt signaling pathway on krasV12- and Myc-induced liver enlargement. 7?dpf fabp10+, kras+ or Myc+ larvae were treated with either 10??M IWR1 or 10??M Cardionogen 1 in the presence of 10??g/ml Dox and 2D liver size was measured based on images. (A?C) Representative images of 7?dpf fabp10+ control larvae. (D?F) Representative images of 7?dpf kras+ larvae. (G?I) Representative images of 7?dpf Myc+ larvae. (J) Quantification of liver sizes for kras+ larvae. (K) Quantification of liver sizes for Myc+ larvae. N?=?20 from each groups; statistical significance: *p?<?0.05, Scale bar?=?20??m. |
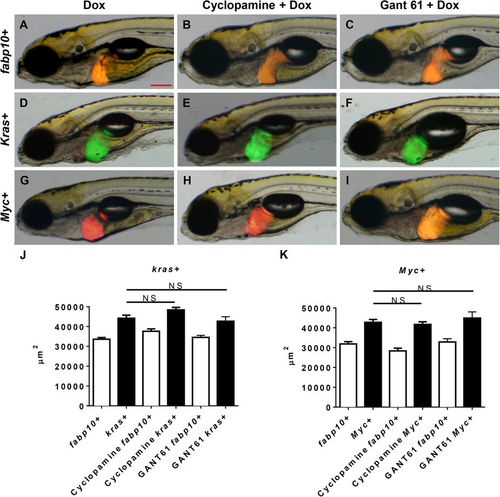
Effect of inhibition of Hedgehog signaling pathway on krasV12- and Myc-induced liver enlargement. 7?dpf fabp10+, kras+ or Myc+ larvae were treated with either 10??M cyclopamine or 1??M GANT61 in the presence of 10??g/ml Dox and 2D liver size was measured based on images. (A?C) Representative images of 7?dpf fabp10+ control larvae. (D?F) Representative images of 7?dpf kras+ larvae. (G?I) Representative images of 7?dpf Myc+ larvae. (J) Quantification of liver sizes for kras+ larvae. (K) Quantification of liver sizes for Myc+ larvae. N?=?20 from each groups; statistical significance: *p?<?0.05, Scale bar?=?20??m. |

Cell proliferation analysis of krasV12- and Myc-induced carcinogenesis. 7?dpf wild type (WT), kras+ or Myc+ larvae were treated with 10??M SU5402, 10??M IWR1 or 10??M cyclopamine in the presence of 10??g/ml Dox. Cell proliferation was analyzed by immunohistochemical staining with PCNA primary antibody. (A?D) Representative liver image of 7?dpf WT larvae. (E?H) Representative liver image of 7?dpf kras+ larvae. (I?L) Representative liver image of 7?dpf Myc+ larvae. (M) Statistical analysis of numbers of proliferating cells in the livers of kras+ larvae. (N) Statistical analysis of numbers of proliferating cells in the livers of Myc+ larvae. N?=?20 from each groups; statistical significance: *p?<?0.05, Scale bar?=?20??m. |
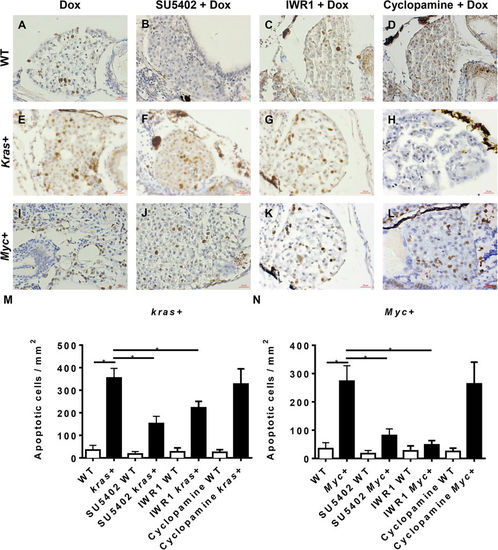
Cell apoptosis analysis of krasV12- and Myc-induced carcinogenesis. 7?dpf WT, kras+ or Myc+ larvae were treated with 10??M SU5402, 10??M IWR1 or 10??M cyclopamine in the presence of 10??g/ml Dox. Apoptosis was analyzed by immunohistochemical staining with digoxigenin-conjugated nucleaotide and incubated with anti-digoxigenin secondary antibody. (A?D) Representative liver images of 7?dpf WT larvae. (E?H) Representative liver images of 7?dpf kras+ larvae. (I?L) Representative liver images of 7?dpf Myc+ larvae. (M) Statistical analysis of numbers of apoptotic cells in the liver of kras?+?larvae. (N) Statistical analysis of numbers of apoptotic cells in the liver for Myc+ larvae. N?=?20 from each groups; statistical significance: *p?<?0.05, Scale bar?=?20??m. |

Histological examination of krasV12- and Myc-induced carcinogenesis. 7?dpf WT, kras+ and Myc+ larvae were treated with 10??M SU5402, 10??M IWR1 or 10??M cyclopamine in the presence of 10??g/ml Dox, and subjected histological analysis. (A?D) Representative liver images of 7?dpf WT larvae. Inset in (A) is a magnified area in the box with arrows pointing nucleoli. (E?H) Representative liver images of 7?dpf kras+ larvae. Inset in (E) is a magnified area in the box with arrows pointing to nucleoli of condensed nuclei. (I?L) Representative liver images of 7?dpf Myc+ liver larvae. Inset in (I) is a magnified area in the box with arrows pointing to nucleoli of condensed nuclei. (M) Quantification of liver histology observed for kras+ larvae. (N) Quantification of liver histology observed for Myc+ larvae. N?=?10 from each group; scale bar?=?20??m. |