
- Title
-
Expression and knockdown of zebrafish folliculin suggests requirement for embryonic brain morphogenesis
- Authors
- Kenyon, E.J., Luijten, M.N., Gill, H., Li, N., Rawlings, M., Bull, J.C., Hadzhiev, Y., van Steensel, M.A., Maher, E., Mueller, F.
- Source
- Full text @ BMC Dev. Biol.
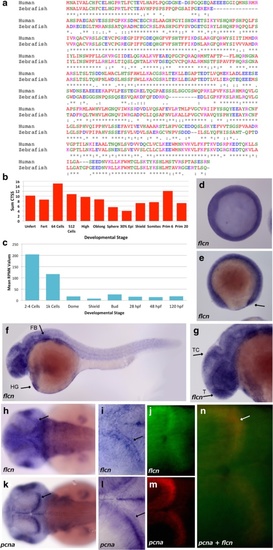
Conservation and expression of zebrafish flcn. a Comparative alignment of human flcn and zebrafish flcn protein sequence using Clustal Omega. (*) indicates positions which have a single, fully conserved residue, (:) indicates conservation between groups of strongly similar properties (.) indicates conservation between groups of weakly similar properties, Red?=?Small (small?+?hydrophobic), Blue?=?Acidic, Magenta?=?Basic ? H, Green?=?Hydroxyl?+?sulfhydryl?+?amine?+?G and Grey?=?Unusual amino/imino acids. b Graph showing CAGE CT values for the zebrafish flcn gene over time, where CT values are the sum of all CAGE detected Transcription Start Site (CTSS) values , representing the number of cage tags (initiation instances) occurring at the same base (normalized tags per million (tps)) in the flcn promoter region. The count value was normalized according to total mapped tags and CTSS instances. c Graph showing the RNAseq RPKM values for zebrafish flcn over time, where the RPKM values represent the mean of the signal coverage value in the promoter region, therefore the sum of the total signal in the whole gene locus region divided by the number of bases with coverage. d Shield stage embryo showing ubiquitous expression. e 4 somite stage embryo showing low level expression over the whole embryo with increased expression seen in the region of the tail bud (arrow). f Prim-10 stage embryo showing low level expression in the whole embryo with more pronounced expression in the forebrain and hindbrain areas, hatching gland (HG, arrow) and the fin bud (FB, arrow). g Head of Prim-10 stage embryo showing expression in the tectum (TC) and telencephalon (T) (arrows). h Long-pec stage embryos showing expression in the brain (arrow) and retina of the embryo. i Long-pec stage embryo showing pronounced expression in the posterior tectum of the brain (arrow). j Head region of a Long-pec stage embryo showing expression of flcn (green) in the posterior tectum. k Long-pec stage embryo showing pcna expression in the retina and brain (arrow). l pcna expression in the posterior tectum of a Long-pec stage embryo (arrow) (m) head region of the same Long-pec stage embryo as panel J showing pcna (red) in the posterior tectum (n) head region of a Long-pec stage embryo showing expression of both pcna (red) and flcn (green) with co-localisation (yellow) in the posterior tectum (n?=?20 embryos for all WMISH) |

Knockdown of flcn in zebrafish embryos. a Schematic from the UCSC genome browser showing the binding sites of the ATG and splice site morpholinos used to knockdown the flcn gene (yellow box) (b) Electrophoresis gel showing; amplified flcn exon 1 and flcn exon 2 transcripts in wild type (WT), 100 ?M of mismatch morpholino injected (sp2 MM) and 100 ?M of flcn splice 2 morpholino injected (sp2 MO) embryos and; amplified flcn exon 1 to intron transcripts in 100 ?M of flcn splice 2 morpholino injected embryos (sp2 MO) with no transcript in wild type (WT) and 100 ?M of mismatch morpholino injected (sp2 MM) embryos (c) Box-whisker plots of flcn qPCR. Results, ?Ct, indicate expression relative to uninjected embryos. Boxes denote interquartile range with central horizontal line showing median expression. Whiskers extend to 1.5 x interquartile range. MO?=?morpholino, MM?=?mismatch. d Prim-5 stage 100 ?M control splice 2 mismatch morpholino injected embryo. e Prim-5 stage 100 ?M control splice 2 mismatch morpholino injected embryo stained with Acridine Orange f Prim-5 stage 100 ?M flcn splice 2 morpholino injected embryo (g) Prim-5 stage 100 ?M flcn splice 2 morpholino injected embryo stained with Acridine Orange (h) Long-pec stage 100 ?M control splice 2 mismatch morpholino injected embryo. i Long-pec stage 100 ?M flcn splice 2 morpholino injected embryo. j Proportion of embryos that are normal (Red), show mild hydrocephalus, larger yolk and thinner yolk extension (blue) or severe hydrocephalus, enlarged yolk and very thin yolk extension (green) when injected with combinations of 100 ?M flcn splice 2 morpholino and 50 pg/?l, 100 pg/?l or 200 pg/?l of flcn RNA. With increasing concentrations of RNA, there was as significant decrease in the proportion of severe hydrocephalus and corresponding increase in the proportion of normal phenotype (ordinal logistic regression, n?=?3 where n is the number of independent injections at each concentration and p?=?0.027) PHENOTYPE:
|

Cell cycle defects in flcn morphant embryos at 18 somite stage of development. Zebrafish Fucci embryo injected with flcn sp2 mismatch control morpholino imaged in (a) Brightfield, (b) fluorescence for Geminin-Azami Green (S/G2/M phase), (c) fluorescence for Cdt1-Kusabira Orange2 and (d) fluorescence merge of Geminin-Azami Green (S/G2/M phase) and Cdt1- Kusabira Orange2 (G1). Zebrafish Fucci embryo injected with flcn sp2 morpholino imaged in (e) Brightfield, (f) fluorescence for Geminin-Azami Green (S/G2/M phase), (g) fluorescence for Cdt1-Kusabira Orange2 and (h) fluorescence merge of Geminin-Azami Green (S/G2/M phase) and Cdt1- Kusabira Orange2 (G1). i Pixel intensity of Geminin-Azami Green in embryos injected with flcn sp2 mopholino injected embryos (solid green line (MO)) when compared with flcn sp2 mismatch control morpholino injected embryos (dashed green line (MM)). Green lines show empirical log(intensity) data distributions. j Pixel intensity of Cdt1-Kusabira Orange2 in embryos injected with flcn sp2 mopholino injected embryos (solid red line (MO)) when compared with flcn sp2 mismatch control morpholino injected embryos (dashed red line (MM)). Red lines show empirical log(intensity) data distributions. Vertical, black lines indicate means, with parameter confidence distributions shown as curved black lines. Vertical, black lines indicate means, with parameter confidence distributions shown as curved black lines EXPRESSION / LABELING:
PHENOTYPE:
|

Cell cycle defects in flcn morphant embryos during somitogenesis. a Zebrafish Fucci embryo showing fluorescence for Cdt1-Kusabira Orange2 (G1 phase) with analysed region of the head indicated by yellow box. b Longitudinal time courses of log(intensity) of pixels from 3 flcn splice 2 mismatch morpholino and 4 flcn splice 2 morpholino injected embryos. Frames were taken at 22 min and 36 s intervals from bud stage for flcn splice 2 mismatch morpholino and 2-somite stage for flcn splice 2 morpholino injected embryos. Red data points represent flcn sp2 morpholino (MO) injected embryos; black data points represent mismatch control morpholino (MM) injected embryos. Solid lines indicate estimated mean trajectories for each treatment group, with dashed lines denoting parameter 95 % confidence intervals. c Bud stage, (d) 2-somite stage, (e) 4-somite stage, (f) 10-somite stage flcn splice 2 mismatch control morpholino injected embryos. g 2-somite stage, (h) 4-somite stage, i 6-somite stage, (j) 10-somite stage flcn splice 2 morpholino injected embryos EXPRESSION / LABELING:
PHENOTYPE:
|

Knockdown of flcn and its effect on cilia and kidney development in Long-pec stage embryos. (A) Electrophoresis gel comparing the size of an amplified flcn transcript in wild type (WT) embryos, embryos injected with flcn splice 1 mismatch morpholino (sp1 MM) and embryos injected with flcn splice 1 morpholino (sp1 MO). (B) Comparative alignment of human flcn and zebrafish flcn protein sequence using Clustal Omega. The red box indicates the sequence and ensuing stop codon that will be translated when the intron is retained in embryos injected with flcn sp1 MO. (*) indicates positions which have a single, fully conserved residue. (C) Long-pec stage embryo injected with 100 ?M splice 1 mismatch morpholino (D) Long-pec stage embryo injected with 100 ?M splice 1 morpholino. (E) Long-pec stage 600 ?M ATG control morpholino injected embryos. (F) Long-pec stage 600 ?M flcn ATG morpholino injected embryo. (G) Fluorescent imaging of Tg(wt1b:EGFP) transgenic zebrafish embryos injected with 100 ?M splice 2 mismatch morpholino. (H) Fluorescent imaging of Tg(wt1b:EGFP) transgenic zebrafish embryos injected with 100 ?M flcn splice 2 morpholino (n?=?8, 2 independent experiments). Images are of the dorsal aspect behind the head region with the head positioned to the left. gl, glomerulus; pt, pronephric tubule (I) Acetylated alpha tubulin-cy3 staining of cilia in 100 ?M splice 2 mismatch morpholino injected Prim-5 stage embryos (J) Acetylated alpha tubulin antibody staining of cilia in 100 ?M splice 2 morpholino injected Prim-5 stage embryos (n?=?10, 2 independent experiments). Images are of the side view of the trunk of the embryo. cc, central canal; pd, pronephric duct. |