
- Title
-
The Notochord Breaks Bilateral Symmetry by Controlling Cell Shapes in the Zebrafish Laterality Organ
- Authors
- Compagnon, J., Barone, V., Rajshekar, S., Kottmeier, R., Pranjic-Ferscha, K., Behrndt, M., Heisenberg, C.
- Source
- Full text @ Dev. Cell
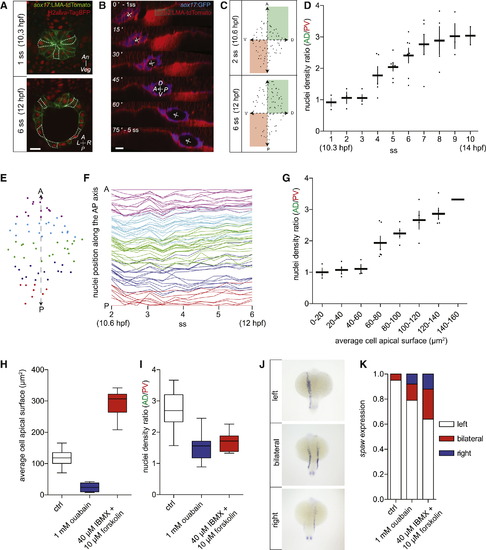
Lumen Growth Drives Cell Shape Change within KV (A) Coronal sections of KV in a Tg(sox17:LMA-tdTomato) embryo, which expresses plasma membrane-targeted tdTomato in KV cells and was injected with h2afva-tagBFP mRNA to label cell nuclei; upper panel, 1 ss (10.3 hpf); lower panel, 6 ss (12 hpf). (B) Sagittal sections of sequential time points during KV formation in a Tg(sox17:GFP; actb2:LMA-tdTomato) embryo starting at 1 ss (10.3 hpf). (C) KV nuclei density distribution along the AP and DV axes during KV formation in a Tg(sox17:GFP) embryo injected with h2afva-mCherry and LMA-tagBFP mRNA at 2 ss (10.6 hpf; upper plot) and 6 ss (12 hpf; lower plot). (D) KV nuclei density ratio between the AD and PV quadrants of KV between 1 ss and 10 ss (10.3?14 hpf); mean � SEM; n = 11 embryos; data were polled from Tg(sox17:GFP) and Tg(sox17:LMA-tdTomato) embryos. (E and F) In (E), a lateral nuclei density plot is shown of KV in a Tg(sox17:GFP) embryo injected with h2afva-mCherry and LMA-tagBFP mRNA at the 2 ss (10.6 hpf) showing the color code used in (F) to plot changes in cell position along a normalized AP axis between 2 ss and 6 ss (10.3?12 hpf). (G) KV nuclei density ratio between the AD and PV quadrants as a function of average KV cell apical surface in 1 ss to 10 ss embryos (10.3?14 hpf; mean � SEM); n = 11 embryos; data were polled from Tg(sox17:GFP) and Tg(sox17:LMA-tdTomato) embryos. (H) Average KV cell apical surface in control (n = 31 time points), ouabain-treated (n = 14 time points), and IBMX + forskolin-treated (n = 7 time points) Tg(sox17:GFP) embryos; data were polled from 5 ss to 7 ss embryos (11.6 - 12.5 hpf). (I) KV nuclei density ratio between the AD and PV quadrants in control (n = 31 time points), ouabain-treated (n = 14 time points), and IBMX + forskolin-treated (n = 7 time points) Tg(sox17:GFP) embryos; data were polled from 5 ss to 7 ss embryos (11.6?12.5 hpf). (J) Phenotypic classes defined for scoring the lateralization of spaw expression by in situ hybridization between 18 ss and 22 ss (18?20 hpf). (K) Quantification of the lateralization of spaw expression in control (n = 77 embryos), ouabain-treated (n = 24 embryos), and IBMX + forskolin-treated (n = 33 embryos) Tg(sox17:GFP) embryos. A, anterior; P, posterior; L, left; R, right; V, ventral; D, dorsal; An, Animal pole; Veg, vegetal pole; ctrl, control. Scale bars in (A) and (B), 20 �m. See also Figure S1. |
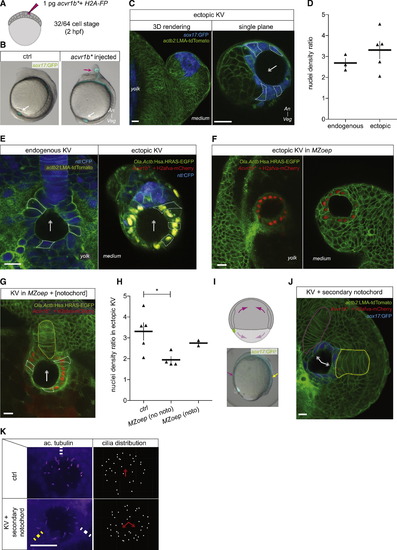
The Notochord Affects KV Cell Shapes (A) Single blastomere injection of constitutively active acvr1b (acvr1b) mRNA at the 32/64-cell stage (1.75/2 hpf) leads to the formation of ectopic KV at the end of gastrulation; mRNA of h2afva fused to a fluorescent protein (FP) is coinjected to label nuclei in the progeny of the injected blastomere. (B) Control (left) and acvr1b-mRNA-injected Tg(sox17:GFP) embryo at 6 ss (12 hpf); white arrow, endogenous KV; purple arrow, ectopic KV. (C) Ectopic KV induced in a Tg(sox17:GFP; actb2:LMA-tdTomato) 6 ss embryo (12 hpf); left panel, 3D rendering; right panel, single plane; arrow points toward the half of the ectopic organ with the highest nuclei density. (D) Maximal nuclei density ratio between organ halves in endogenous (n = 3 embryos) and ectopically (n = 5 embryos) located KV with comparable average cell apical surfaces (between 100 and 120 �m2) in Tg(sox17:GFP) embryo at 6 ss (12 hpf); mean � SEM. (E) Endogenous (left panel) and ectopic (right panel) KVs in Tg(Ola.Actb:Has.HRAS-EGFP; -1ntla:CFP) embryos at 6 ss (12 hpf); arrow points toward the half of the organ with the highest nuclei density. (F) Ectopic KVs in MZoep; Tg(Ola.Actb:Has.HRAS-EGFP) embryos at 6 ss (12 hpf) located between the yolk and the epiblast (left panel) and between the enveloping layer and the epiblast (right panel). (G) Ectopic KV in a MZoep; Tg(Ola.Actb:Has.HRAS-EGFP) embryo at 6 ss (12 hpf) adjacent to a coinduced notochord (labeled by H2afva-mcherry, yellow dashed line); arrow points toward the half of the ectopic organ with the highest nuclei density. (H) Maximal nuclei density ratio between organ halves in ectopic KV at 6 ss (12 hpf) in control Tg(sox17:GFP) (n = 5 embryos), MZoep; Tg(Ola.Actb:Has.HRAS-EGFP) (n = 4 embryos), and MZoep; Tg(Ola.Actb:Has.HRAS-EGFP) with coinduced notochord (n = 2 embryos) embryos with comparable average cell apical surfaces (between 100 and 120 �m2); mean � SEM; p < 0.05 (Mann-Whitney test). (I) Single marginal blastomere injection of acvr1b mRNA at the 16-cell stage (2 hpf) leads to the formation a secondary axis, whose notochord contacts the posterior side of endogenous KV at the end of gastrulation; upper panel schematizes a gastrulating embryo with both endogenous and induced axes; lower left panel shows a Tg(sox17:GFP) embryo at 80% epiboly (8.5 hpf) injected with Acvr1b mRNA at the 16-cell stage (2 hpf) with both primary (purple arrow) and secondary (yellow arrow) axes. (J) KV adjacent to the notochord from both the primary (purple dashed line) and secondary (yellow dashed line) axes in a Tg(sox17:GFP; actb2:LMA-tdTomato) embryo at 6 ss (12 hpf). (K) α-Acetylated tubulin staining of KV in Tg(sox17:GFP) control embryos (upper panels) at 6 ss (12 hpf) and in similar staged embryos with a secondary axis where KV is adjacent to the notochord from both the primary (white dashed line) and secondary (yellow dashed line) axes; panels at the right show the corresponding cilia distribution based on z-projections. An, animal pole; Veg, Vegetal pole; noto, notochord; Ac. Tubulin, acetylated tubulin; ctrl, control. Scale bars for (C), (E), (F), (G), (J), and (K), 20 �m. See also Figure S2B. |

The Notochord Affects KV Cell Shape by Polarizing Laminin Deposition around KV (A) α-Laminin-α1β1γ1 antibody staining of KV in Tg(sox17:GFP) embryos at 1 ss (10.3 hpf; coronal section, A.1) and 6 ss (12 hpf; sagittal section, A.2 and A.3); A.4 and A.5 show insets of the region boxed in upper panels. (B) Thickness of the KV epithelium [n = 42 measurements on 3 Tg(sox17:GFP) embryos]; box and whisker plot. (C) Basal α-laminin-α1β1γ1 antibody staining intensity along KV epithelium in the same sections used for (B); n = 6 lines measurements; see dashed line in (A) for location; box and whisker plot; red line, trend based on the local average method. (D) α-FN-1 antibody and DAPI staining on 6 ss (12 hpf) Tg(sox17:GFP) embryo (coronal section). (E) α-Laminin-α1β1γ1 antibody and DAPI staining on ectopic KV in 6 ss (12 hpf) Tg(sox17:GFP) (left panel), MZoep; Tg(sox17:GFP) (middle panel), and MZoep; Tg(sox17:GFP) with a coinduced notochord (arrow in right panel) embryos. (F) Ratio of nuclei densities between the AD and PV quadrants of KV as a function of average KV cell apical surface; mean � SEM. Control n = 11 embryos; laminin γ1-MO1-cell n = 15 embryos; laminin γ1-MODFC n = 7 embryos; embryos injected with 40 pg truncated FN 1a and 1b mRNA n = 4 embryos. Data were polled from Tg(sox17:GFP) and Tg(sox17:LMA-tdTomato) embryos between 1 ss and 10 ss (10.3-14 hpf). (G) Projected cilia length in control embryos and embryos injected with laminin γ1 MO either into the YSL between the 512- and 1,000-cell stages or at the 1-cell stage. p < 0.0001 (t test); n > 140 cilia for each condition; n > 5 embryos for each condition. (H) Projected cilia length in control embryos and embryos injected with 40 pg truncated FN 1a and 1b mRNA; n > 89 cilia for each condition; n > 3 embryos for each condition; ns, p value (t test) > 0.05 (I) Quantification of the lateralization of spaw expression between 18 ss and 22 ss (20?22 hpf) by in situ hybridization in control (n = 18 embryos) and embryos injected with 40 pg truncated FN 1a and 1b mRNA (n = 36 embryos). A, anterior; P, posterior; L, left; R, right; V, ventral; D, dorsal; ns, not significant; YSL, yolk syncytial layer; ctrl, control; trunc. fibro., embryos injected with 40 pg truncated FN 1a and 1b mRNA. Scale bars in (A), (D), and (E), 20 �m. See also Figure S3. |
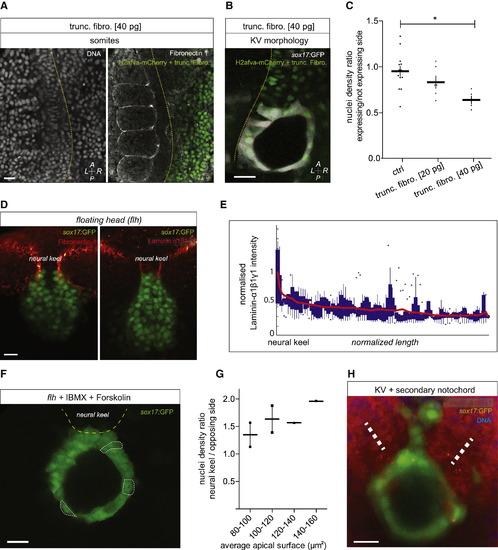
Polarized Distribution of ECM around KV Determines Regional Differences in KV Cell Shape (A) Sections on the dorsal side of a Tg(sox17:GFP) embryo at 6 ss (12 hpf) injected at the two-cell stage with h2afva-mCherry mRNA and 40 pg truncated FN 1a and 1b mRNA. Left panel, DAPI staining; right panel, α-FN-1 antibody staining. (B) Coronal KV section on Tg(sox17:GFP) embryos at 6 ss (12 hpf) injected at the two-cell stage with h2afva-mCherry and 40 pg truncated FN 1a and 1b mRNA. (C) Ratio of cell densities between the mRNA-injected side and the noninjected side; mean � SEM; data were polled from Tg(sox17:GFP) between the 6 ss and 8 ss (12?13 hpf); p < 0.05, Mann-Whitney test. Control, n = 14 embryos; embryos injected with 20 pg truncated FN 1a and 1b mRNA, n = 6; embryos injected with 40 pg truncated FN mRNA, n = 5. (D) α-FN-1 antibody staining (left) and α-laminin-α1β1γ1 antibody staining (right) in 6 ss (12 hpf) flh; Tg(sox17:GFP) embryos. (E) Basal α-laminin-α1β1γ1 antibody staining intensity along KV epithelium; n = 6 lines measurements on 3 flh; Tg(sox17:GFP) embryos; box and whisker plot; red line, trend based on the local average method. (F) KV in a flh; Tg(sox17:GFP) embryo at 6 ss (12 hpf) treated with 40 �M IBMX and 10 �M forskolin from 1 ss (10.3 hpf) onward; neural keel side is up. (G) Ratio of cell densities between neural keel and the opposing side as a function of average apical surface (mean � SEM); data were polled from 3 ss to 7 ss (11?12.5 hpf) flh; Tg(sox17:GFP) embryos treated with 40 �M IBMX and 10 �M forskolin from 1 ss (10.3 hpf) onward; n = 6 embryos. (H) α-Laminin-α1β1γ1 antibody staining of KV adjacent to the notochord (white dashed lines) of both the primary and secondary axes in Tg(sox17:GFP) embryos at 6 ss (12 hpf). A, anterior; P, posterior; L, left; R, right; V, ventral; D, dorsal; crtl; control; trunc. fibro., embryos injected with 40 pg truncated FN 1a and 1b mRNA. Scale bars for (A), (B), (D), (F), and (H), 20 �m. |
Reprinted from Developmental Cell, 31, Compagnon, J., Barone, V., Rajshekar, S., Kottmeier, R., Pranjic-Ferscha, K., Behrndt, M., Heisenberg, C., The Notochord Breaks Bilateral Symmetry by Controlling Cell Shapes in the Zebrafish Laterality Organ, 774-783, Copyright (2014) with permission from Elsevier. Full text @ Dev. Cell