
Fig. 4
- ID
- ZDB-FIG-150805-10
- Publication
- Compagnon et al., 2014 - The Notochord Breaks Bilateral Symmetry by Controlling Cell Shapes in the Zebrafish Laterality Organ
- Other Figures
- All Figure Page
- Back to All Figure Page
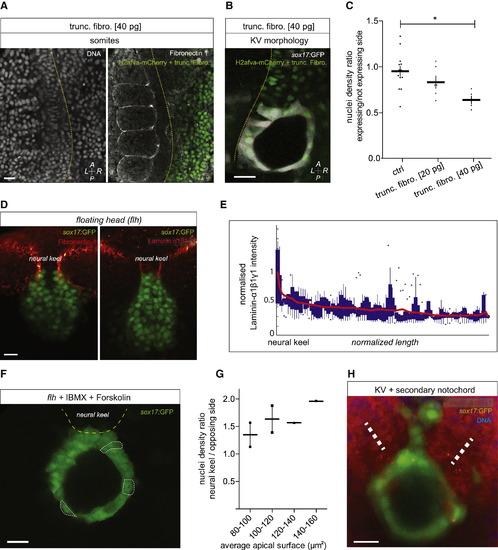
Polarized Distribution of ECM around KV Determines Regional Differences in KV Cell Shape (A) Sections on the dorsal side of a Tg(sox17:GFP) embryo at 6 ss (12 hpf) injected at the two-cell stage with h2afva-mCherry mRNA and 40 pg truncated FN 1a and 1b mRNA. Left panel, DAPI staining; right panel, α-FN-1 antibody staining. (B) Coronal KV section on Tg(sox17:GFP) embryos at 6 ss (12 hpf) injected at the two-cell stage with h2afva-mCherry and 40 pg truncated FN 1a and 1b mRNA. (C) Ratio of cell densities between the mRNA-injected side and the noninjected side; mean ± SEM; data were polled from Tg(sox17:GFP) between the 6 ss and 8 ss (12–13 hpf); p < 0.05, Mann-Whitney test. Control, n = 14 embryos; embryos injected with 20 pg truncated FN 1a and 1b mRNA, n = 6; embryos injected with 40 pg truncated FN mRNA, n = 5. (D) α-FN-1 antibody staining (left) and α-laminin-α1β1γ1 antibody staining (right) in 6 ss (12 hpf) flh; Tg(sox17:GFP) embryos. (E) Basal α-laminin-α1β1γ1 antibody staining intensity along KV epithelium; n = 6 lines measurements on 3 flh; Tg(sox17:GFP) embryos; box and whisker plot; red line, trend based on the local average method. (F) KV in a flh; Tg(sox17:GFP) embryo at 6 ss (12 hpf) treated with 40 µM IBMX and 10 µM forskolin from 1 ss (10.3 hpf) onward; neural keel side is up. (G) Ratio of cell densities between neural keel and the opposing side as a function of average apical surface (mean ± SEM); data were polled from 3 ss to 7 ss (11–12.5 hpf) flh; Tg(sox17:GFP) embryos treated with 40 µM IBMX and 10 µM forskolin from 1 ss (10.3 hpf) onward; n = 6 embryos. (H) α-Laminin-α1β1γ1 antibody staining of KV adjacent to the notochord (white dashed lines) of both the primary and secondary axes in Tg(sox17:GFP) embryos at 6 ss (12 hpf). A, anterior; P, posterior; L, left; R, right; V, ventral; D, dorsal; crtl; control; trunc. fibro., embryos injected with 40 pg truncated FN 1a and 1b mRNA. Scale bars for (A), (B), (D), (F), and (H), 20 µm. |
Reprinted from Developmental Cell, 31, Compagnon, J., Barone, V., Rajshekar, S., Kottmeier, R., Pranjic-Ferscha, K., Behrndt, M., Heisenberg, C., The Notochord Breaks Bilateral Symmetry by Controlling Cell Shapes in the Zebrafish Laterality Organ, 774-783, Copyright (2014) with permission from Elsevier. Full text @ Dev. Cell