
- Title
-
Silencer-delimited transgenesis: NRSE/RE1 sequences promote neural-specific transgene expression in a NRSF/REST-dependent manner
- Authors
- Xie, X., Mathias, J.R., Smith, M.A., Walker, S.L., Teng, Y., Distel, M., Koster, R.W., Sirotkin, H.I., Saxena, M.T., and Mumm, J.S.
- Source
- Full text @ BMC Biol.
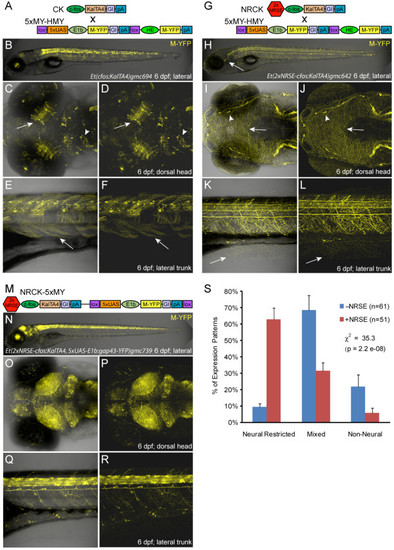
Enhancer trap comparisons αNRSE. Plasmid diagrams and representative confocal images of Gal4 expressing enhancer trap lines �NRSE, one CK (A-F) and two types of NRCK (G-L and M-R) lines are shown (6 dpf). (A) CK driver and 5xMY-HMY reporter plasmid diagrams. (B-F) The majority of CK lines showed expression in multiple tissues (B), with neural expression in regions such as the tectum (C, D, arrows) and midbrain (C, D, arrowheads) as well as labeling of skeletal muscle (E, F, arrows). (G) NRCK driver and 5xMY-HMY reporter plasmid diagrams. (H-L) The majority of NRCK lines displayed neuronally restricted expression patterns (H), dense innervation patterns in the skin indicate somatosensory neuron labeling (H-L, arrows), neuromast innervation is also evident in this line (I, J, arrowheads). (M) NRCK-5xMY plasmid diagram. (N-R) Like NRCK lines, the majority of NRCK-5xMY ′self-reporting′ lines displayed neuronally restricted expression. The density of reporter labeling was typically high with near ubiquitous expression throughout the central nervous system being common (O-R). (S) Quantification of phenotypes from non-NRSE (-NRSE, blue bars, total of 61 lines) and NRSE-containing enhancer trap lines (+NRSE, red bars, total of 51 lines). Expression patterns were classified as either neural-restricted (as in H-L and N-R), mixed (as in B-F), or non-neural (example not shown). The data shows a clear trend toward neuronally restricted expression patterns when NRSE elements are included in enhancer trap transgenes. To evaluate the significance of this trend, chi-square tests of independence were performed comparing the αNRSE phenotyping datasets. The results show clear statistical differences across all lines αNRSE (values shown in graph) and between matched subsets (CK versus NRCK, χ2 = 18.5, P = 9.8e-05; CK-5xN-14xY versus NRCK-5xMY, χ2 = 16.4, P = 2.7e-04). The error bars indicate the standard deviation in phenotype between the two +NRSE and -NRSE transgenic lines. |
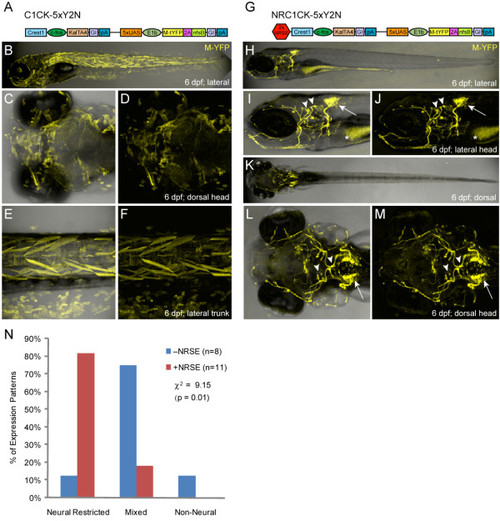
CREST1-cfos transgene comparisons �NRSE. Plasmid diagrams and representative confocal images of lines derived with the CREST1-cfos enhancer-minimal promoter element �NRSE, one C1CK-5xY2N (A-F) and one NRC1CK-5xY2N (G-M) line is shown (6 dpf). (A) C1CK-5xY2N plasmid diagram. (B-F) The majority of C1CK-5xY2N lines showed mixed expression patterns (B), with labeling of epidermis, skeletal muscle and notochord often evident (C-F). (G) NRC1CK-5xY2N plasmid diagram. (H-M) The majority of NRC1CK-5xY2N lines had expression restricted to a cranial motor neuron subpopulation (H) - the expression pattern originally characterized as CREST1-specified [35] - including cranial nerve X neurons in the hindbrain (arrows, I, J and L, M) and cranial nerve VII and V neurons in the midbrain (arrowheads, I, J and L, M). Autofluorescence in the gut is marked by asterisks (I, J). (N) Quantification of phenotypes from non-NRSE (-NRSE, blue bars, total of eight lines) and NRSE-containing (+NRSE, red bars, total of 11 lines) CREST1-cfos lines; expression patterns were classified as either neural-restricted (as in H-M), mixed (as in B-F), or non-neural (example not shown). The data shows a clear trend toward neuronally restricted expression patterns when NRSE elements are included in CREST1-cfos transgenes. A chi-square test of independence showed significant differences between the �NRSE phenotyping datasets (values shown in graph). |
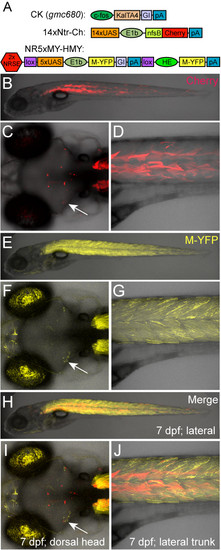
UAS reporter comparison αNRSE. Plasmid diagrams and representative confocal images at 6 dpf of a triple transgenic larva where Gal4 is driving two reporters αNRSE, a non-NRSE mCherry reporter line (B-D, 14xNTR-Ch (c264)) and a NRSE-containing YFP reporter line (E-G, NR5xMY-HMY (gmc932), merged images H-J). (A) CK, 14xNtr-Ch and NR5xMY-HMY plasmid diagrams. (B-D) The control mCherry reporter (non-NRSE) shows a typical mixed expression pattern with neuronal subsets (C, arrow) and skeletal muscle labeling (D). (E-G) The NRSE-UAS YFP reporter showed expanded expression in skeletal muscle (compare D and G) and a similar pattern in the brain (F, arrow). Note that autofluorescence from iridiphores in the eye is also evident in the YFP emission channel. (H-J) Merged image showing that the addition of NRSE sites to UAS reporter plasmids is not sufficient to restrict reporter expression to the nervous system; i.e., the subset of neurons labeled in the brain (I, arrow). Presumably due to reduced silencing of the NR5xMY-HMY line, there is actually an expansion of YFP reporter expression throughout skeletal muscle. |

Delayed repression of non-neural transgene expression. (A-H) Representative time series confocal images of 4- and 7-dpf transgenic larvae showing gradual loss of reporter expression from non-neural tissues; a common phenotype of NRSE-delimited Gal4-VP16 driver lines. (A-D) Time series of a triple transgenic larva from a cross between an NRSE-delimited Gal4-VP16 (KalTA4) driver line (NRCK gmc607), an mCherry reporter line (Tg(14xUAS:nfsb-mCherry)c264), and a pan-neuronal marker for neuronal expression, Tg(elavl3:EGFP)knu3 line (formerly HuC:GFP [56]). Image magnifications of bordered regions in A and C show skeletal muscle expression fading over time (B and D, arrows), while neuronal expression is maintained (B and D, arrowheads). Expression within the gut (dashed line) is an enteric neuron subpopulation; note 100% overlap with the pan-neural elavl3:GFP reporter (co-expressing cells appears yellow). (E-H) Time series of a double transgenic larva from a cross between an NRSE-delimited Gal4-VP16 (KalTA4) driver line (NRCK gmc607) and the YFP-expressing reporter line (5xMY-HMY gmc930). Image magnifications of bordered regions in E and G show skeletal muscle expression also fades over time when driver lines are crossed to YFP reporter lines (F and H, arrows), thus this phenomenon is not a result of NRSE-independent silencing of the reporter (as has been shown for the Tg(14xUAS:nfsb-mCherry)c264 line [48, 49]). YFP expression typically takes longer to decay than mCherry, possibly due to stronger basal expression and/or absence of methylation due to the reduced number of UAS elements [49] or barrier insulator sequences. Note that the membrane-tagged YFP reporter improves visualization of axonal and dendritic neuronal outgrowths, e.g., the labeled enteric neuron subpopulation in the gut. |

Delayed repression of non-neural transgene expression. (A-H) Representative time series confocal images of 4- and 7-dpf transgenic larvae showing gradual loss of reporter expression from non-neural tissues; a common phenotype of NRSE-delimited Gal4-VP16 driver lines. (A-D) Time series of a triple transgenic larva from a cross between an NRSE-delimited Gal4-VP16 (KalTA4) driver line (NRCK gmc607), an mCherry reporter line (Tg(14xUAS:nfsb-mCherry)c264), and a pan-neuronal marker for neuronal expression, Tg(elavl3:EGFP)knu3 line (formerly HuC:GFP [56]). Image magnifications of bordered regions in A and C show skeletal muscle expression fading over time (B and D, arrows), while neuronal expression is maintained (B and D, arrowheads). Expression within the gut (dashed line) is an enteric neuron subpopulation; note 100% overlap with the pan-neural elavl3:GFP reporter (co-expressing cells appears yellow). (E-H) Time series of a double transgenic larva from a cross between an NRSE-delimited Gal4-VP16 (KalTA4) driver line (NRCK gmc607) and the YFP-expressing reporter line (5xMY-HMY gmc930). Image magnifications of bordered regions in E and G show skeletal muscle expression also fades over time when driver lines are crossed to YFP reporter lines (F and H, arrows), thus this phenomenon is not a result of NRSE-independent silencing of the reporter (as has been shown for the Tg(14xUAS:nfsb-mCherry)c264 line [48,49]). YFP expression typically takes longer to decay than mCherry, possibly due to stronger basal expression and/or absence of methylation due to the reduced number of UAS elements [49] or barrier insulator sequences. Note that the membrane-tagged YFP reporter improves visualization of axonal and dendritic neuronal outgrowths, e.g., the labeled enteric neuron subpopulation in the gut. |

Summary. Schematic summarizing our findings regarding NRSE-delimited transgene expression within the context of bipartite driver (B) and effector/reporter lines (C). In each panel, the driver transgene (e.g., Gal4-based) is at the top and the reporter/effector (e.g., UAS) is at the bottom. Transgene products Gal4 and Cherry are shown as circles and ovals, respectively. (A) In the absence of NRSE sites, bipartite driver systems are prone to broad non-specific expression patterns with evidence of so-called background expression in skeletal muscle and heart (see Figures 1 and 2). (B) Associating NRSE sites with effector/reporter transgenes is not sufficient to restrict transgene expression to the nervous system (see Figure 3), possibly due to an inability to overcome enhanced transcriptional activity typical of artificial bipartite drivers (e.g., Gal4-VP16). (C) Incorporating NRSE sites into driver transgenes serves to bias expression toward neuronal specific patterns (see Figures 1 and 2). These findings suggest that creating novel associations between regulatory activators (e.g., enhancers) and silencer elements (e.g., NRSE sites) is a useful strategy for attaining tissue-specific expression patterns that extend beyond what can be obtained with standard transgenesis techniques. |

Enhancer trap comparisons �NRSE. Confocal images of an additional 12 NRCK (left box) and 6 CK (right box) lines are shown in support of the phenotypic data summarized in Figure 1S. Each line is designated by a transgenic allele number (e.g., gmc601) and with the phenotypic characterization (e.g., Neural, Mixed, Non-Neural) provided in the lower right of each image set. Additional high resolution imaging data is available on line at [47]. |
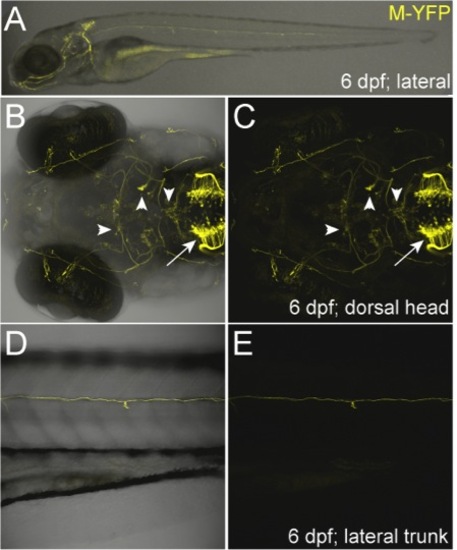
High-resolution imaging of branchiomotor neuron labeling. (A-E) Confocal images of 6-dpf NRC1CK-5xY2N transgenic line (Tg(2xNRSE-CREST1-cfos:KalTA4, 5xUAS-E1b:YFP-2A-nfsB)lmc003) showing specific labeling of branchiomotor neuron ganglia. When NRSE sites were placed upstream of CREST1-cfos, expression became restricted to cranial motor neuron subpopulations; the expression pattern originally characterized as CREST1-specified [35]. (B, C) Motor ganglia expression included cranial nerve X (vagus, arrow in hindbrain region), VII (facial, down arrowhead), anterior and posterior V (trigeminal, up arrowhead); IV and III (trochlear and oculomotor, respectively, right arrowhead). (D, E) Unidentified descending spinal nerve. |

High-resolution imaging of branchiomotor neuron labeling. (A-E) Confocal images of 6-dpf NRC1CK-5xY2N transgenic line (Tg(2xNRSE-CREST1-cfos:KalTA4, 5xUAS-E1b:YFP-2A-nfsB)lmc003) showing specific labeling of branchiomotor neuron ganglia. When NRSE sites were placed upstream of CREST1-cfos, expression became restricted to cranial motor neuron subpopulations; the expression pattern originally characterized as CREST1-specified [35]. (B, C) Motor ganglia expression included cranial nerve X (vagus, arrow in hindbrain region), VII (facial, down arrowhead), anterior and posterior V (trigeminal, up arrowhead); IV and III (trochlear and oculomotor, respectively, right arrowhead). (D, E) Unidentified descending spinal nerve. |

Hatching enzyme promoter-based transgene ′tracer′. Stereoscope micrograph shows expression of he1a:YFP ′tracer′ transgene in 1-dpf embryos. This element allows transgenic UAS reporter lines (e.g., Tg(loxP-5xUAS-E1b:gap43-YFP-loxP, he1a:gap43-YFP)gmc830, shown here) to be visually sorted from non-transgenic siblings (asterisks) at embryonic to early larval stages in the absence of Gal4 driver expression. The 365 bp he1a promoter is robustly active (arrow) from 1 to 3 dpf, after which expression rapidly fades. Inclusion of this element in UAS reporter lines has greatly simplified maintenance of our stocks. |