
|
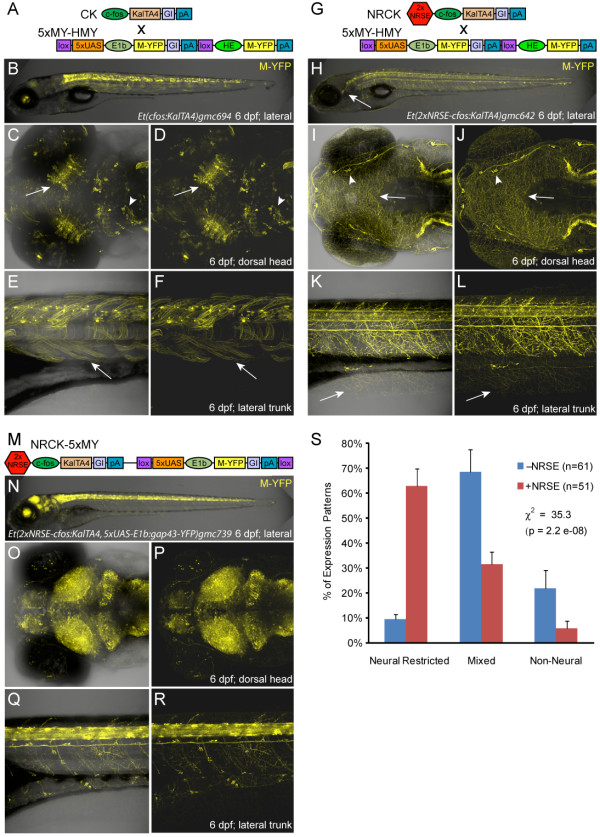
Fig. 1 Enhancer trap comparisons αNRSE. Plasmid diagrams and representative confocal images of Gal4 expressing enhancer trap lines ±NRSE, one CK (A-F) and two types of NRCK (G-L and M-R) lines are shown (6 dpf). (A) CK driver and 5xMY-HMY reporter plasmid diagrams. (B-F) The majority of CK lines showed expression in multiple tissues (B), with neural expression in regions such as the tectum (C, D, arrows) and midbrain (C, D, arrowheads) as well as labeling of skeletal muscle (E, F, arrows). (G) NRCK driver and 5xMY-HMY reporter plasmid diagrams. (H-L) The majority of NRCK lines displayed neuronally restricted expression patterns (H), dense innervation patterns in the skin indicate somatosensory neuron labeling (H-L, arrows), neuromast innervation is also evident in this line (I, J, arrowheads). (M) NRCK-5xMY plasmid diagram. (N-R) Like NRCK lines, the majority of NRCK-5xMY ′self-reporting′ lines displayed neuronally restricted expression. The density of reporter labeling was typically high with near ubiquitous expression throughout the central nervous system being common (O-R). (S) Quantification of phenotypes from non-NRSE (-NRSE, blue bars, total of 61 lines) and NRSE-containing enhancer trap lines (+NRSE, red bars, total of 51 lines). Expression patterns were classified as either neural-restricted (as in H-L and N-R), mixed (as in B-F), or non-neural (example not shown). The data shows a clear trend toward neuronally restricted expression patterns when NRSE elements are included in enhancer trap transgenes. To evaluate the significance of this trend, chi-square tests of independence were performed comparing the αNRSE phenotyping datasets. The results show clear statistical differences across all lines αNRSE (values shown in graph) and between matched subsets (CK versus NRCK, χ2 = 18.5, P = 9.8e-05; CK-5xN-14xY versus NRCK-5xMY, χ2 = 16.4, P = 2.7e-04). The error bars indicate the standard deviation in phenotype between the two +NRSE and -NRSE transgenic lines.