
- Title
-
Prostaglandin Gbetagamma signaling stimulates gastrulation movements by limiting cell adhesion through Snai1a stabilization
- Authors
- Speirs, C.K., Jernigan, K.K., Kim, S.H., Cha, Y.I., Lin, F., Sepich, D.S., DuBois, R.N., Lee, E., and Solnica-Krezel, L.
- Source
- Full text @ Development
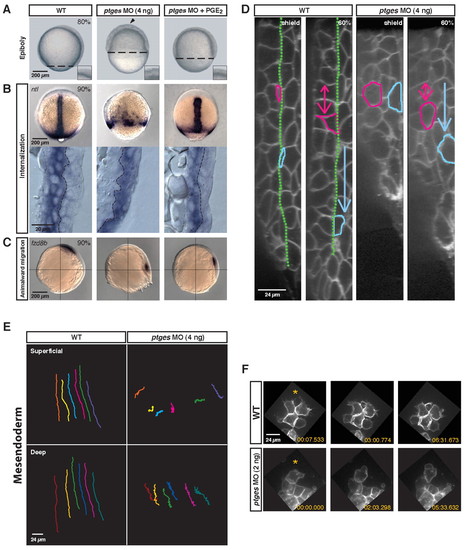
Depletion of PGE2 causes global gastrulation defects. ptges MO-injected (4 ng) zebrafish embryos were evaluated for gastrulation movement defects. (A) Live embryos (80% epiboly). WT, uninjected wild type; ptges MO (4 ng), Ptges-deficient; ptges MO (4 ng) + PGE2, Ptges-deficient embryos treated with 10 mM PGE2. Dashed line indicates the progress of epiboly. Arrowhead indicates the uneven surface of the blastoderm. The inset shows the blastoderm surface at high magnification. (B) (Top) Deficit of internalized no tail-expressing axial mesodermal cells in ptges morphants (90% epiboly; dorsal views). (Bottom) Lateral views of cryosections through the dorsal side of the embryo. Yolk cell, left; external surface, right; dashed line, germ layer boundary. (C) Migration of fzd8b-expressing prechordal mesoderm cells towards the animal pole (90% epiboly; lateral views). (D) Confocal images (lateral view) of the dorsal midline in membrane EGFP-labeled embryos at shield stage. Yolk cell, left; external surface, right. The green line marks the boundary between the superficial (blue cell) and deep layers (pink cell) of the gastrula. Arrows indicate the vector of movement. (E) The paths of six cells in the superficial and deep layers of the mesendoderm in wild-type and ptges morphant embryos. Vegetal pole, top; animal pole, bottom. (F) Confocal images of prechordal mesoderm cells (70% epiboly). Three frames from a time-lapse movie are shown. Orange asterisks are towards the animal pole. |
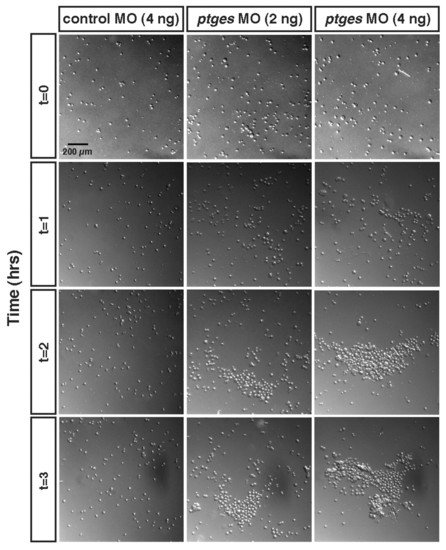
Decreased PGE2 results in dramatically enhanced embryonic cell-cell adhesion. Cell adhesion assay of cells from dissociated control and ptges morphant gastrulae. Images of dissociated blastomeres on the fibronectin substrate were taken every hour for 3 hours. Note the clumping of cells in the Ptges-deficient gastrulae. |

PGE2 governs cell adhesion by decreasing Cdh1 transcript and protein levels. (A) Quantitative real-time PCR (qRT-PCR) of β-actin (left) and cdh1 (right) transcript levels in control and ptges morphants at 60% epiboly. **, P<0.005. (B) Western blot of E-cadherin (top) and Gapdh (bottom, loading control) from shield-stage zebrafish embryos injected with control and ptges MOs. The two isoforms of E-cadherin present during zebrafish development have been described previously (Babb and Marrs, 2004); the larger isoform is dominant during gastrulation. (C) Confocal images of whole-mount E-cadherin immunostaining. E-cadherin protein expression (red) at the shield stage in the mesoderm (lateral view). Blue, nuclear stain. (D) Suppression of the cell clumping phenotype (arrowhead) in ptges morphants by cdh1 MO injection. Embryos are at the shield stage. (E) A compilation of two experiments in which control and ptges morphant embryos were co-injected with cdh1 MO (1 ng) and evaluated at 60% epiboly for the cell clumping phenotype. |
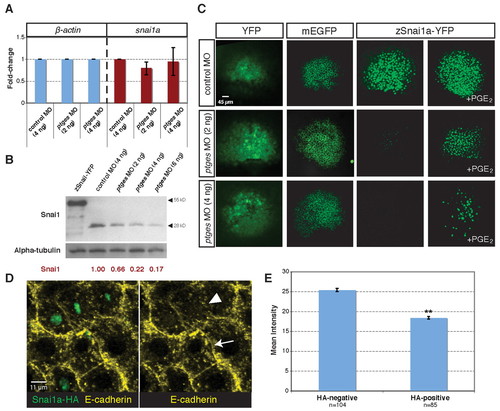
PGE2 deficiency destabilizes Snai1a protein. (A) qRT-PCR of β-actin (left) and snai1a (right) transcript levels in control and ptges morphants at 60% epiboly. (B) Immunoblotting using antibodies against Snai1a (top) and α-tubulin (loading control, bottom) in control and ptges morphants. The first lane shows zebrafish embryos that were injected with snai1a-yfp (which encodes a protein of 55 kDa). (C) Confocal images of Snai1a-YFP, YFP, and membrane EGFP expression in control (top row) and ptges morphants (middle and bottom rows), and ptges morphants incubated with PGE2 (shield stage). (D) Confocal images of ptges morphant gastrulae (shield stage) stained with anti-HA (green) and anti-E-cadherin (yellow) that were mosaically injected with snai1a-HA RNA (3 pg) at the 8- to 16-cell stage. Compare the intensity of E-cadherin staining at the membranes between two HA-positive cells (arrowhead) with that between two HA-negative cells (arrow). (E) Quantitation of E-cadherin immunostaining intensity (mean intensity) of Snai1a-HA-negative and Snai1a-HA-positive cells in ptges morphant gastrulae. **, P=1.16x10⁻¹⁰. |
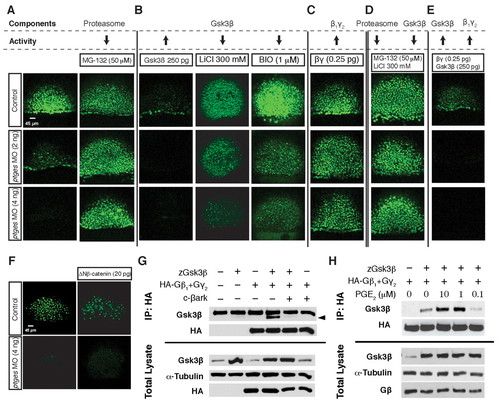
PGE2/Gβγ signaling stabilizes Snai1 by inhibiting Gsk3β-mediated proteasomal degradation. (A-E) Confocal images of zebrafish embryos in which the Snai1a-YFP assay was used to test downstream components of PGE2 signaling for their ability to affect levels of Snai1a in control (top row) and ptges morphants (middle and bottom rows). (A) Treatment with the proteasome inhibitor MG132. (B) Injection of zebrafish gsk3β RNA and treatment with the Gsk3β inhibitors LiCl and BIO. (C) Injection of human Gβ1 and Gγ2 RNA. (D) Inhibition of both Gsk3β and the proteasome (MG132 treatment). (E) human Gβ1γ2 and zebrafish gsk3β RNA co-injection. (F) Snai1a-YFP expression in control (top row) and ptges morphants (bottom row) injected with RNA encoding constitutively activeΔNβ-catenin. (G) Immunoblotting of Gsk3β following immunoprecipitation with human Gβ1γ2. Zebrafish Gsk3β and HA-tagged human Gβ1γ2 were transfected into HEK-293T cells. Cell extracts were immunoprecipitated with anti-HA, then immunoblotted with anti-Gsk3β (Gsk3β indicated by arrowhead). The interaction between Gsk3β and human Gβ1γ2 was blocked by the addition of c-βark (top). Total lysate western blots are shown at the bottom. (H) Immunoblotting of Gsk3β following PGE2 treatment and immunoprecipitation with human Gβ1γ2. Zebrafish Gsk3β and HA-tagged human Gβ1γ2 were transfected into HEK-293T cells, then cells were treated with 0.1, 1 and 10 μM PGE2 prior to collecting the cell extracts in NDLB. Cell extracts were immunoprecipitated with anti-HA, then immunoblotted with anti-Gsk3β. Total lysate western blots are shown at the bottom. |
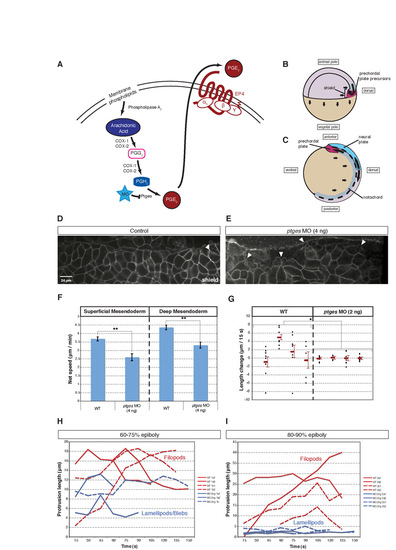
Qualitative and quantitative analysis of cell migration in Ptges-deficient embryos during gastrulation. (A) Schematic of PGE2 synthesis. Blue star, location of pathway inhibition by MO. COX, Cyclooxygenase-/Prostaglandin-endoperoxide synthase type 1 and 2; PGG2, Prostaglandin G2; PGH2, Prostaglandin H2; PGE2, Prostaglandin E2; MO, antisense morpholino oligonucleotide; Ptges, Prostaglandin E synthase; EP4, E-prostanoid 4 receptor. (B,C) Schematic of gastrulation movements in zebrafish at the shield (B) and tailbud (C) stages. (D,E) Protrusive activity of axial mesodermal cells undergoing epiboly (yolk cell-embryonic cell margin) in control (D) and tailbud (E) embryos. Arrowhead, blebbing activity. (F) The net speed (µm/minute) of superficial and deep mesendodermal cells in control embryos and ptges morphants. **, P<1×10⁻⁴. (G) Quantitation of the length changes (µm/15 seconds) of four prechordal mesoderm cell protrusions per sample during the time-lapse. Cellular protrusions from ptges morphants show less extension and retraction than those from control embryos (*, P=0.03). Red line, average protrusion length. (H,I) Protrusion length in prechordal mesoderm cells migrating anteriorly towards the animal pole. Four protrusions (embryo 1, solid lines; embryo 2, dashed lines) were analyzed in control (red) and ptges (blue) morphant gastrulae at 60-75% (H) and 80-90% (I) epiboly during time-lapse imaging. Control morphant protrusions are filopodia (length>width; diameter<2 μm), whereas ptges morphant protrusions exhibit lamellipodial (width>length; length>2 μm) or bleb-like characteristics (Montero et al., 2003). |
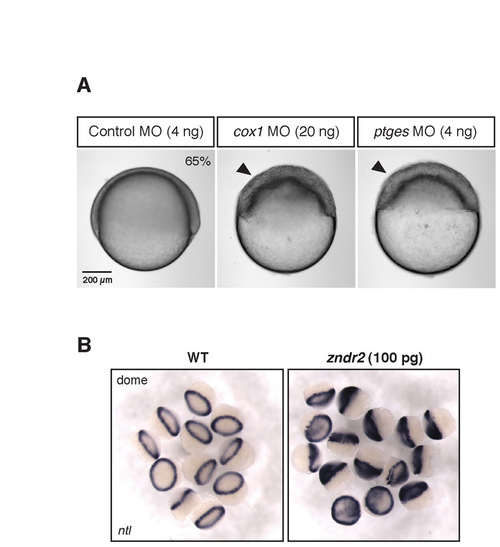
Analysis of cell adhesion changes in Cox1- and Ptges-deficient embryos. (A) The cell clumping phenotype is also seen in cox1 morphants. (B) Ndr2 overexpression converts most of the embryonic tissue to ntl-expressing mesendodermal cells. These embryos are then dissociated for the cell adhesion assay (Fig. 2). |
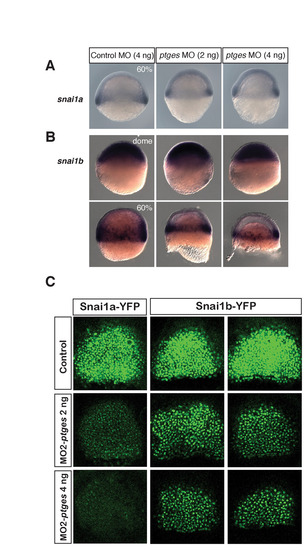
snai1a and snai1b transcript levels during gastrulation. (A) snai1a transcripts shown by in situ hybridization at 60% epiboly. (B) snai1b transcripts revealed by in situ hybridization at dome and 60% epiboly. Control and ptges morphants have indistinguishable expression until 60% epiboly, when the expression domain remains the same but fewer internalized snai1b-positive cells are present in the ptges morphants. (C) Snai1b-YFP expression is mildly decreased with injection of MO2-ptges. Embryos injected with synthetic RNAs encoding Snai1a-YFP (positive control) and Snail1-YFP are co-injected with MO2-ptges and imaged by confocal microscopy at the shield stage (6 hpf). Two representative embryos from each sample of snai1b-yfp-injected embryos are shown. |
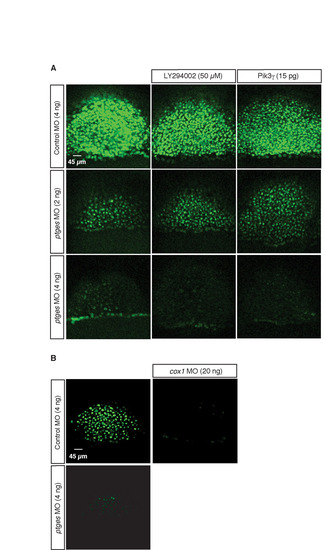
Pik3γdoes not significantly affect Snai1a stability. (A) Confocal images of embryos expressing Snai1a-YFP at the shield stage injected with either control or ptges MO that were either co-injected with RNA encoding Pik3γ (15 pg) at the one-cell stage or treated with Pik3 inhibitor (LY294002, 50 μM) from the dome to the shield stage (Montero et al., 2003). (B) Confocal images of embryos expressing Snai1a-YFP at the shield stage. Embryos co-injected with ptges MO and cox1 MO (20 ng). |

Full scans for all the western blots shown. (A) Full scan for Fig. 3B; (B) Full scan for Fig. 4B; (C) Full scan for Fig. 5F. |