
|
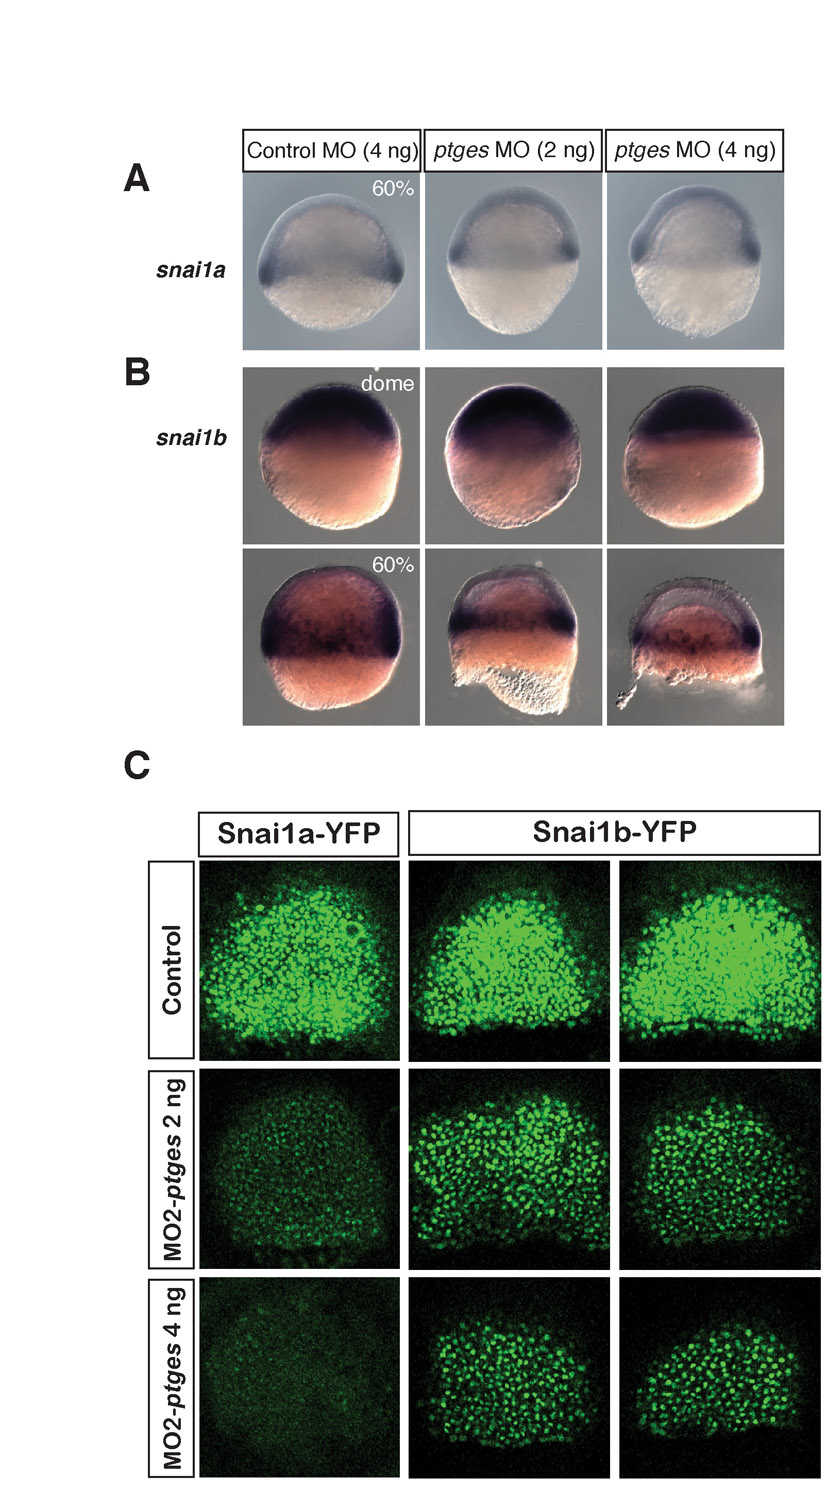
Fig. S3 snai1a and snai1b transcript levels during gastrulation. (A) snai1a transcripts shown by in situ hybridization at 60% epiboly. (B) snai1b transcripts revealed by in situ hybridization at dome and 60% epiboly. Control and ptges morphants have indistinguishable expression until 60% epiboly, when the expression domain remains the same but fewer internalized snai1b-positive cells are present in the ptges morphants. (C) Snai1b-YFP expression is mildly decreased with injection of MO2-ptges. Embryos injected with synthetic RNAs encoding Snai1a-YFP (positive control) and Snail1-YFP are co-injected with MO2-ptges and imaged by confocal microscopy at the shield stage (6 hpf). Two representative embryos from each sample of snai1b-yfp-injected embryos are shown.