
|
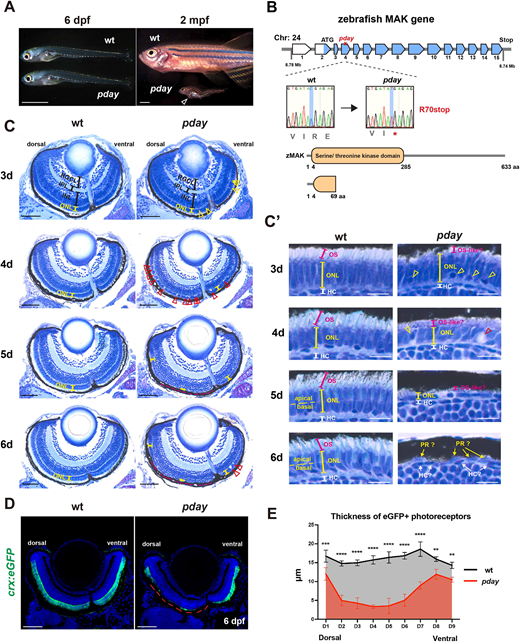
Fig. 1 The zebrafish mak mutant pday shows photoreceptor degeneration. (A) pday mutants at 6 days post fertilization (dpf) and 2 months post fertilization (mpf). At 6 dpf, pday mutants showed no morphological differences from wild-type (wt) siblings. At 2 mpf, pday mutants had smaller bodies with less-developed fins, scoliosis and cardiac edema (open arrowhead). (B) The zebrafish mak gene consists of 15 exons and encodes 633 amino acids (aa) with a serine/threonine kinase domain. In pday mutants, a nonsense mutation (R70stop) results in a truncated protein lacking most of the kinase domain. (C) Wild-type and pday mutant retinas. The outer nuclear layer (ONL) in pday mutants showed dense nuclear granules (yellow arrowheads), bubble-like structures (red arrowheads) and reduced ONL thickness (yellow lines). In pday mutants, the dorso-central ONL progressively decreased in thickness after 4 dpf, became extremely flat at 5 dpf and disappeared at 6 dpf (red dotted lines). INL, inner nuclear layer; IPL, inner plexiform layer; RGCL, retinal ganglion cell layer. (C′) Higher magnification of the central ONL. The outer segment (OS) was drastically reduced in pday mutants (red lines). Dense nuclear granules (yellow arrowheads), bubble-like structures (red arrowheads) and the progressive reduction of ONL thickness (yellow lines) were observed in pday mutants. HC, horizontal cells; PR, photoreceptors. (D) Wild-type and pday mutant retinas carrying the transgenic line Tg[crx:eGFP]. Nuclei were counterstained with Hoechst 33342 (blue). crx:eGFP (green) expression was more severely decreased in the dorsal retina (red dotted line) than in the ventral retina of pday mutants. (E) Thickness of eGFP-positive photoreceptors along the dorso-ventral axis of the retina. The thickness was more severely decreased in the dorsal retina than in the ventral retina of pday mutants. Color bars and lines indicate mean±s.d. Statistical difference was evaluated with two-way ANOVA and Sidak's multiple comparison tests; n=3 for each point. **P<0.01; ***P<0.001; ****P<0.0001. Sample sizes are shown in Table S3. Scale bars: 1 mm (A); 50 µm (C); 10 µm (C′); 40 µm (D).