
Image
|
Figure Caption
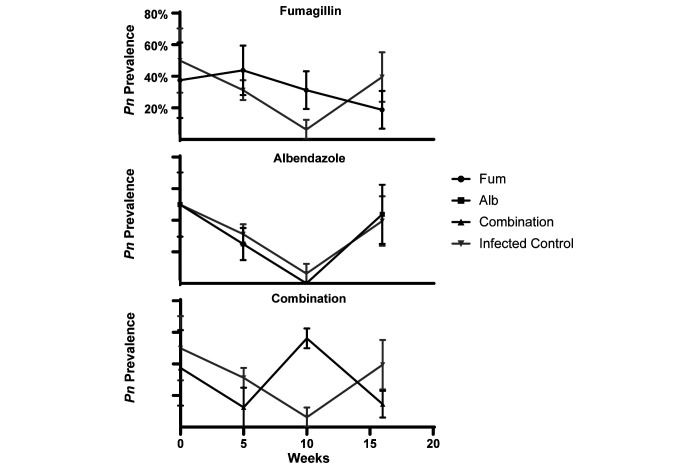
Fig. 3 Plots demonstrating Pn prevalence over time as determined by whole-body qPCR at 5, 10, and 16-wk time points. The figure shows predicted means and associated standard error bars from raw data. Prevalence of the infected control group was compared to each of the treatment groups. There was no significant association between treatment group and Pn prevalence. The Pn prevalence obtained for the uninfected control group was 0 at all time points, and this group is omitted from this figure.
Acknowledgments
This image is the copyrighted work of the attributed author or publisher, and
ZFIN has permission only to display this image to its users.
Additional permissions should be obtained from the applicable author or publisher of the image.
Full text @ Comp. Med.