
Image
|
Figure Caption
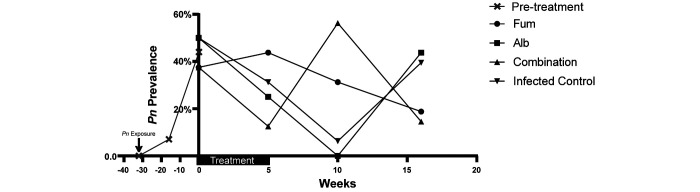
Fig. 2 The left side of the Y axis shows Pn prevalence following Pn exposure. At the beginning of the experiment (week 0), overall Pn prevalence across groups was 44%. The right side of the Y axis demonstrates Pn prevalence for each experimental group over time following treatment. The Pn prevalence obtained for the uninfected control group was 0 at all time points, and this group is omitted from this figure.
Acknowledgments
This image is the copyrighted work of the attributed author or publisher, and
ZFIN has permission only to display this image to its users.
Additional permissions should be obtained from the applicable author or publisher of the image.
Full text @ Comp. Med.