
|
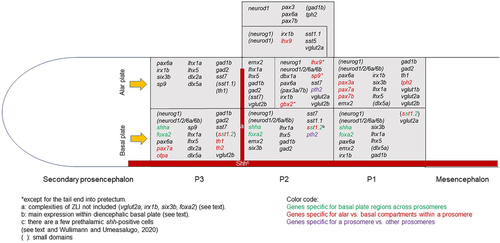
Fig. 11 Schematic depictions of gene expression domains in larval zebrafish forebrain regions investigated and shown in Figure 1. Note that the antero-posterior neural axis is shown without bending. Note also that six3b, emx2, and lhx5/1a expression is not entered in basal P3 (i.e., M2) because these cells likely originate from basal P1. Likewise, lhx9-positive cells are not entered in alar P1 (i.e., M1) because they likely originate from alar P2. Furthermore, the caudal deviation into P1 of the P2 domains of gbx2 and lhx9 (see text) is not entered into the schema. For further information see text and Table 1.