
|
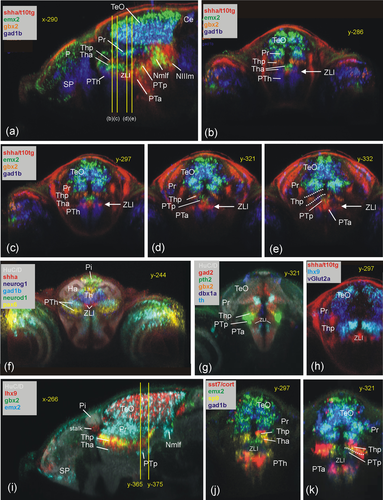
Fig. 5 Thalamic zebrafish gene expression (Th). Sagittal section (a) and four consecutive transverse sections (b–e) outline genoarchitectonic differences between anterior and posterior thalamus (Tha/Thp) using gbx2, emx2, and gad1b. Note that shha is expressed basally (PTp) and in zona limitans intrathalamica (ZLI) (see text). (f) Transverse section shows most rostral thalamus (using neurog1, neurod1, and pax6a expression). (g–k) Additional thalamic gene expression in transverse (g: pth2 and dbx1a; h: lhx9 and vglut2a; j,k: sp9, emx2, and sst7) and sagittal planes (i: lhx9, gbx2, and emx2; note peculiar tail end of Thp domains transgressing into P1 between y-levels 365–375; see text). Note also that overlap of lhx9 and gbx2 label in (i) leads to artificial yellow signal. Ce, cerebellum; Ha, habenula; Nmlf, region of the nucleus of the medial longitudinal fascicle; NIIIm, oculomotor nucleus; P, pallium; Pi, pineal; Po, preoptic area; Pr, pretectum; PTh, prethalamus; PTp, posterior part of posterior tuberculum; SP, subpallium; TeO, tectum opticum; Tha, anterior thalamus; Thp, posterior thalamus; ZLI, zona limitans intrathalamica.