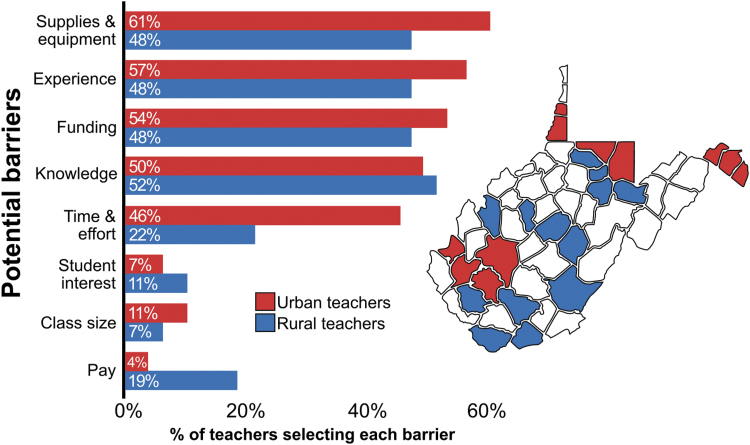
IMAGE

FIG. 4.

ID
ZDB-IMAGE-240425-44
Source
Figures for Coltogirone et al., 2023
Image
Figure Caption

FIG. 4.

Concerns for implementing new approaches to science education as reported by HSTA teachers. Graph represents the percentage of teachers (total n = 55, rural n = 27, urban n = 28) selecting factors that might prevent them from using zebrafish or other innovative strategies as a tool for enhanced science education. Red bars represent urban teachers, and blue bars represent rural teachers. Map depicts the distribution of counties represented by the teachers (n = 24/55 counties). The color code corresponds to the color code on the graph; red counties are urban and blue counties are rural. HSTA, Health Sciences and Technology Academy.

Acknowledgments
This image is the copyrighted work of the attributed author or publisher, and ZFIN has permission only to display this image to its users. Additional permissions should be obtained from the applicable author or publisher of the image. Full text @ Zebrafish