
|
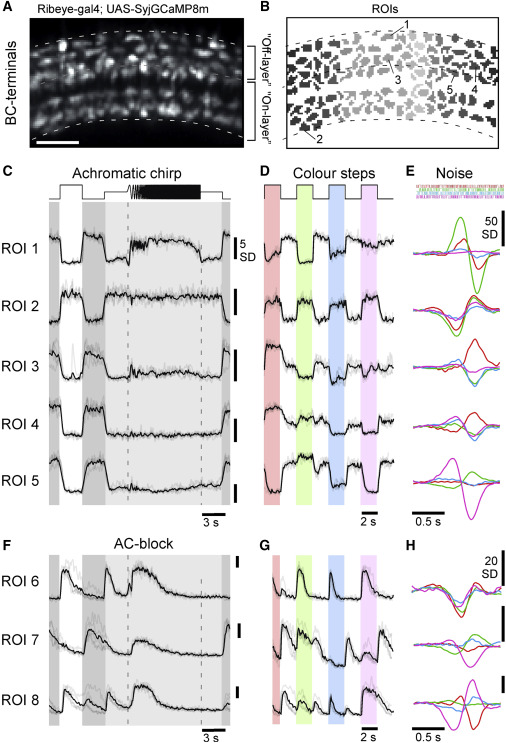
Fig. 4 Effects of AC blockage on BCs (A and B) Example scan field (A) and ROI mask (B) of a typical scan from BC terminals expressing SyjGCaMP8m,44,45 with approximate IPL boundaries and On/Off layer separation indicated. Scale bar, 5 μm. (C–E) Example ROIs from (A) and (B) as indicated, responding to the white chirp (C) and color steps (D), alongside mean spectral kernels recovered from 4-color noise stimulation (E). (F–H) As (C–E), respectively, but for three different example terminals that were recorded after pharmacological injections of GABAzine, TPMPA, and strychnine to block inhibitory inputs from ACs. Note that responses are generally larger and more transient compared with control conditions, but diverse spectral opponencies persist. Scale bars: 5 SD (C, D, F, and G), 50 SD (E), and 20 SD (H).