
|
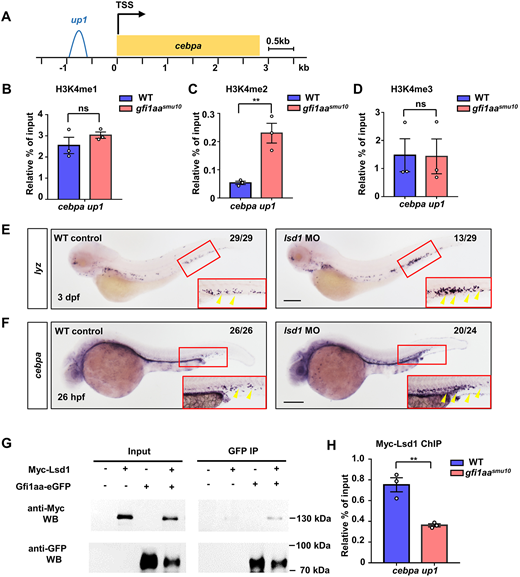
Fig. 6 Gfi1aa epigenetically represses cebpa via Lsd1. (A) Schematic of the cebpa promoter. Gfi1aa binding on the cebpa promoter region is labeled with up1 (−0.6kb∼−0.9 kb). (B-D) ChIP-qPCR of the H3K4me1 (B), H3K4me2 (C) and H3K4me3 (D) status at the up1 cebpa promoter locus in WT and gfi1aasmu10 mutant embryos reveals that Gfi1aa inhibits H3K4me2 at the up1 locus of cebpa. Results are represented as percentage of input normalized to the negative control, etv2 exon 8. **P<0.01 (Student's t-test, mean±s.e.m. of three independent experiments). ns, not significant. (E,F) lsd1 MO phenocopies the neutrophil lineage expansion of the gfi1aasmu10 mutant. (E) Expression of lyz in WT control (n=29) and lsd1 MO (n=29) embryos at 3 dpf by WISH. (F) Expression of cebpa in WT control (n=26) and lsd1 MO (n=24) embryos at 26 hpf by WISH. The numbers in the top right corners indicate the number of embryos exhibiting the representative expression. Insets show enlargements of the red boxed regions of the CHT. Yellow arrowheads indicate the signals Scale bars: 200 μm. P<0.0001 (Fisher's exact test). (G) Protein interaction of Myc-Lsd1 and Gfi1aa-eGFP. Co-immunoprecipitation of Myc-tagged Lsd1 and eGFP-tagged Gfi1aa in zebrafish embryos. (H) Myc-Lsd1 binding to the cebpa locus is dependent on Gfi1aa. ChIP-qPCR shows Myc-Lsd1 enrichment in the cebpa promoter locus in WT and gfi1aasmu10 mutant embryos. Data are represented as percentage of input normalized to the negative control, etv2 exon 8. **P<0.01 (Student's t-test, mean±s.e.m. of three independent experiments)