
|
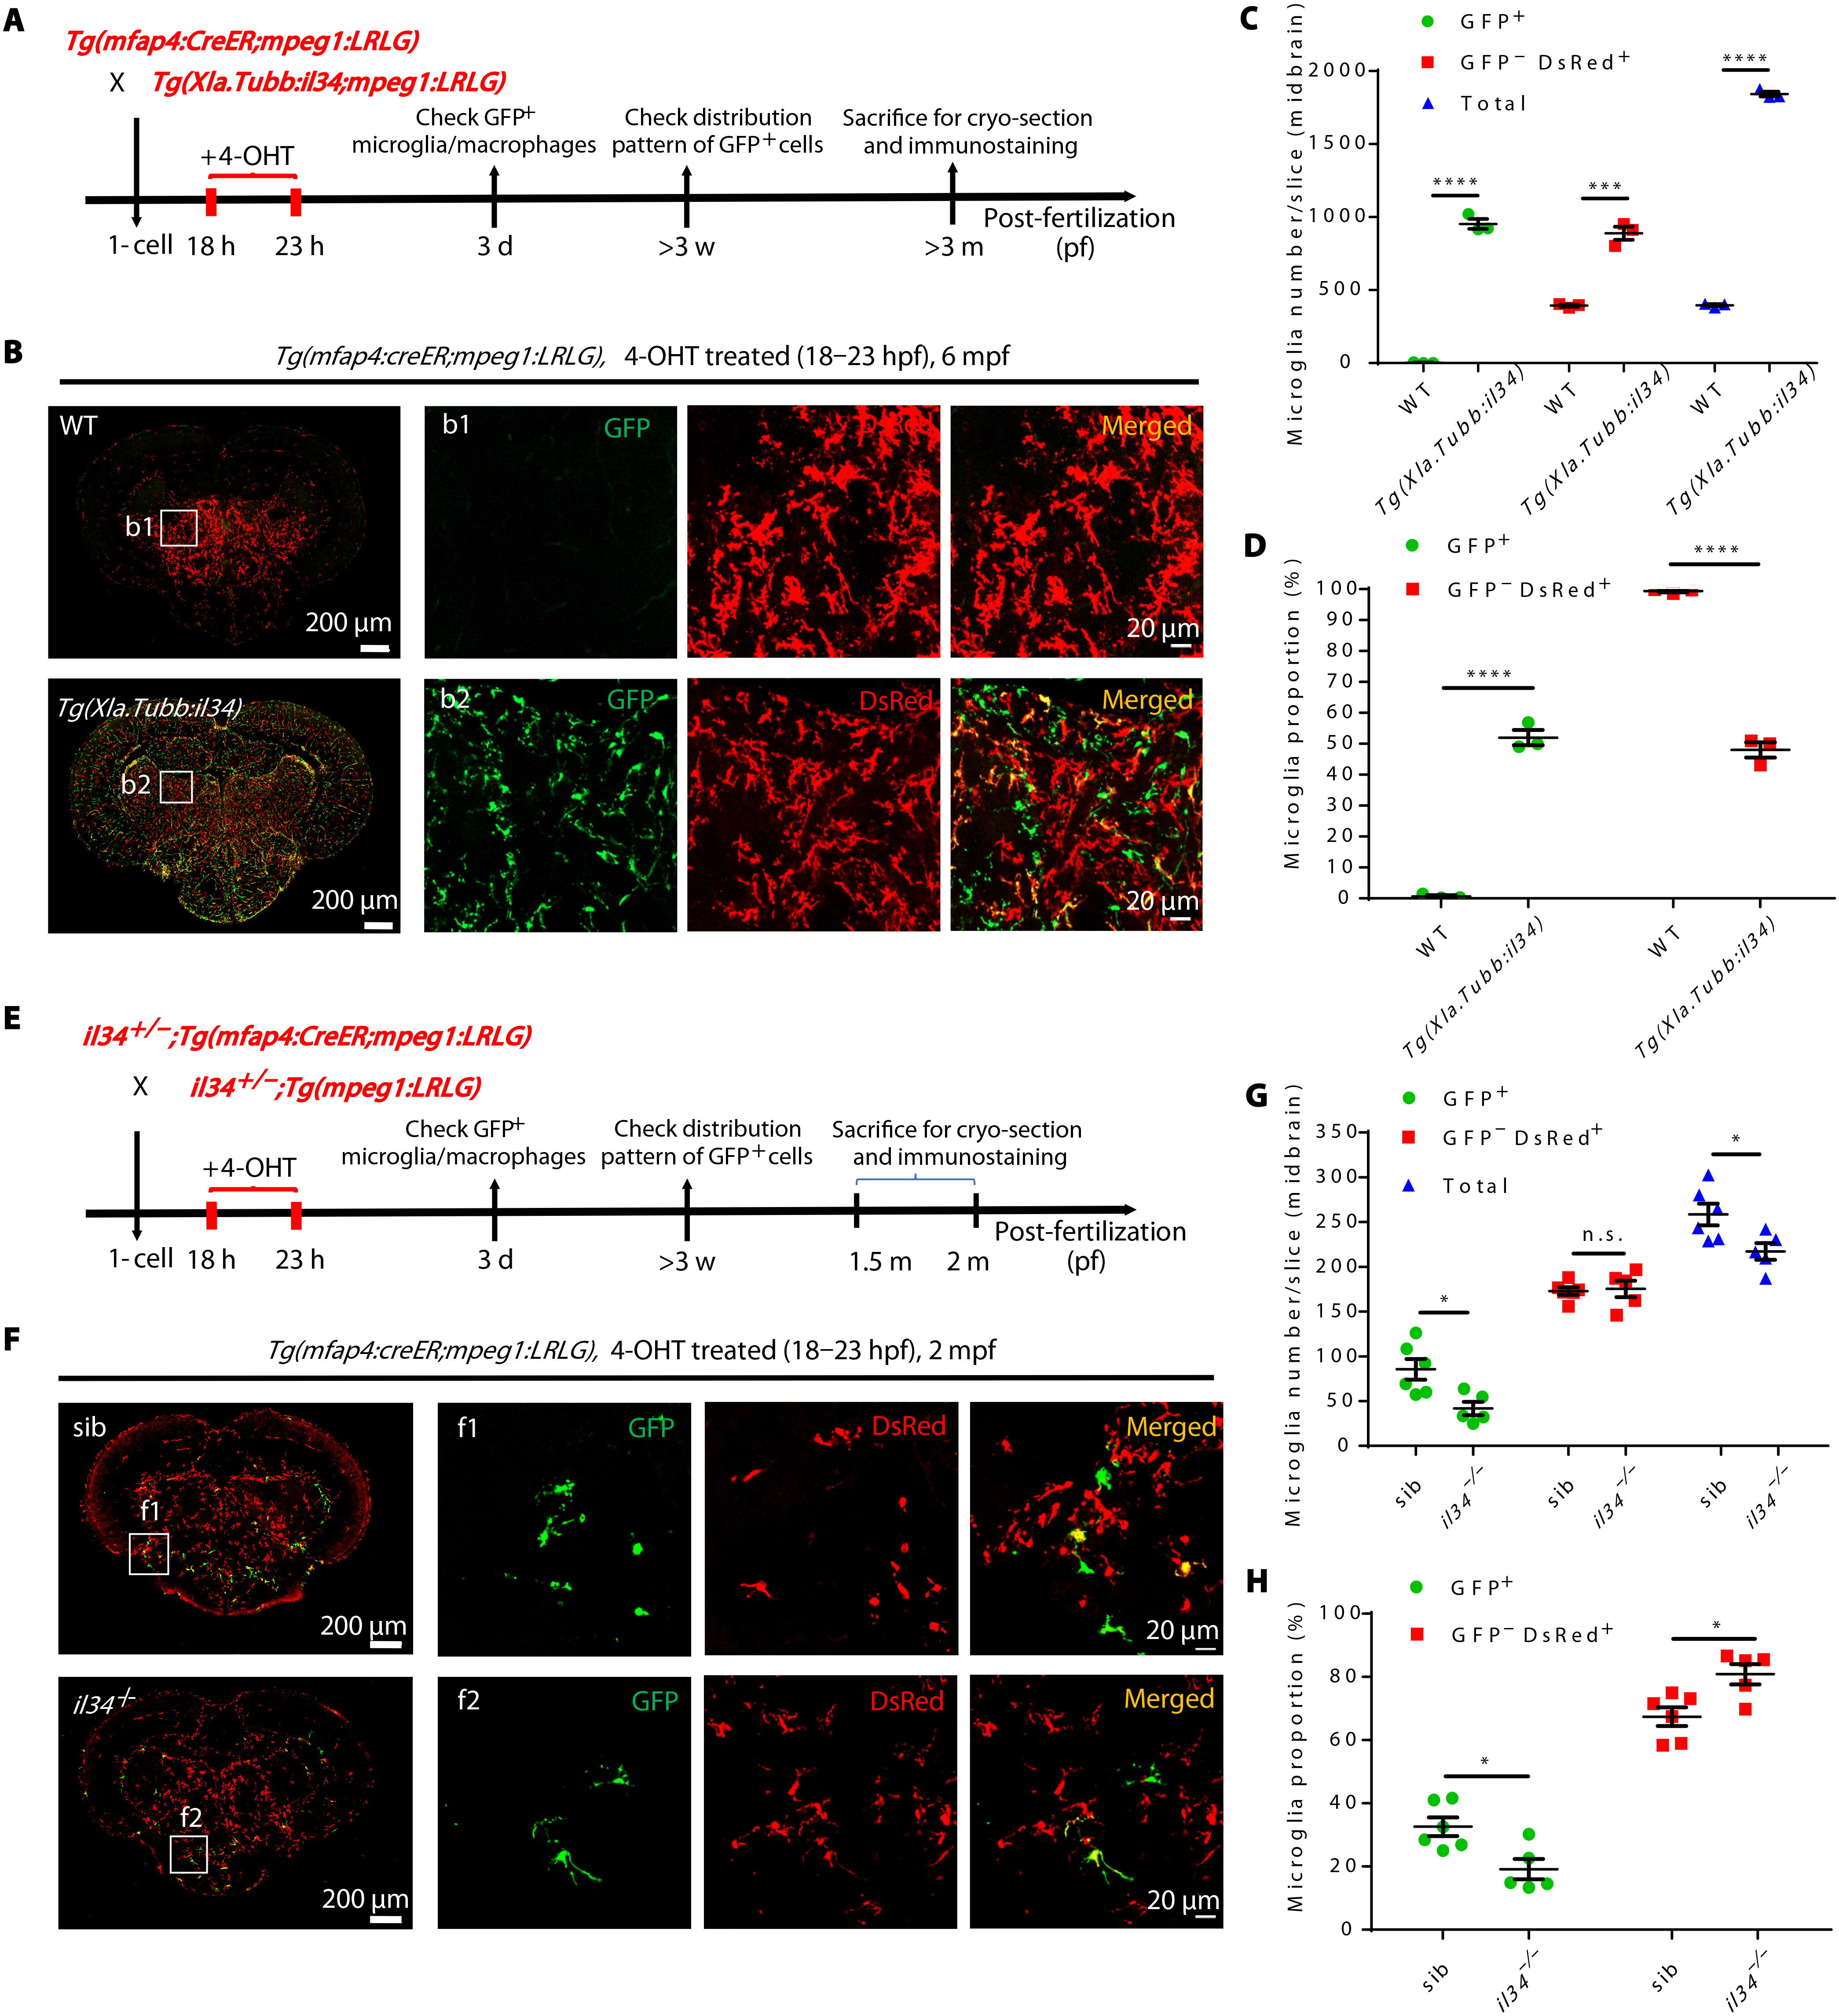
Fig. 4 Alteration of neuron-derived Il34 level changes the proportion and lifespan of RBI microglia. (A) Schematic diagram shows the experimental setup for RBI microglia tracing in WT and Tg(Xla.Tubb:il34) fish. (B) Representative images of the midbrain cross section of 4-OHT–treated Tg(mfap4:creER;mpeg1:LRLG) and Tg(Xla.Tubb:il34;mfap4:creER;mpeg1:LRLG) fish at 6 mpf. GFP+ and GFP−DsRed+ cells represent RBI and AGM microglia, respectively. (C and D) Quantification of the number (C) and proportion (D) of RBI (GFP+) and AGM (GFP−DsRed+) microglia in (B) (n = 3 for each genotype). (E) Schematic diagram shows the experimental setup for RBI microglia tracing in siblings and il34−/− mutants. (F) Representative images of the midbrain cross section of 4-OHT–treated Tg(mfap4:CreER;mpeg1:LRLG) siblings and il34−/−;Tg(mfap4:CreER;mpeg1:LRLG) mutant fish at 2 mpf. GFP+ and GFP−DsRed+ cells represent RBI and AGM microglia, respectively. (G and H) Quantification of the number (G) and proportion (H) of RBI (GFP+) and AGM (GFP−DsRed+) microglia in (F) (sibling n = 6, il34−/− n = 5). n.s., P > 0.05; *P < 0.05; ***P < 0.001; ****P < 0.0001 (Student’s t test). Data were presented as mean ± SEM.