
Image
|
Figure Caption
Fig. 2
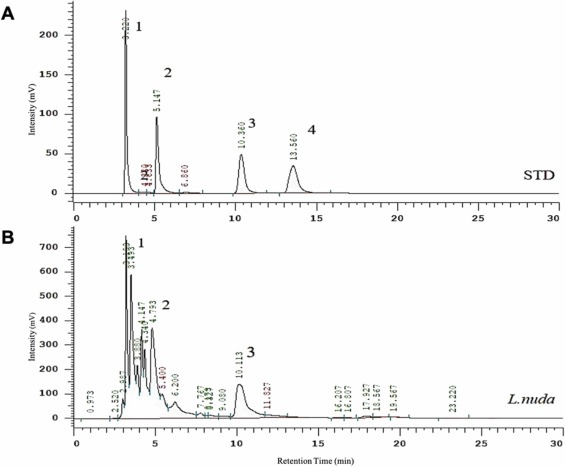
Fig. 2. Representative results of HPLC analysis of L. nuda extract. (A) HPLC chromatogram of a mixture of 4 bioactive components as standards and identified peaks represented as 1 (ergothioneine), 2 (eritadenine), 3 (adenosine), and 4 (cordycepin). (B) HPLC chromatogram of the L. nuda water extract shows a peak relevant to ergothioneine (peak 1), eritadenine (peak 2), and adenosine (peak 3).
Acknowledgments
This image is the copyrighted work of the attributed author or publisher, and
ZFIN has permission only to display this image to its users.
Additional permissions should be obtained from the applicable author or publisher of the image.
Full text @ Biomed. Pharmacother.