
|
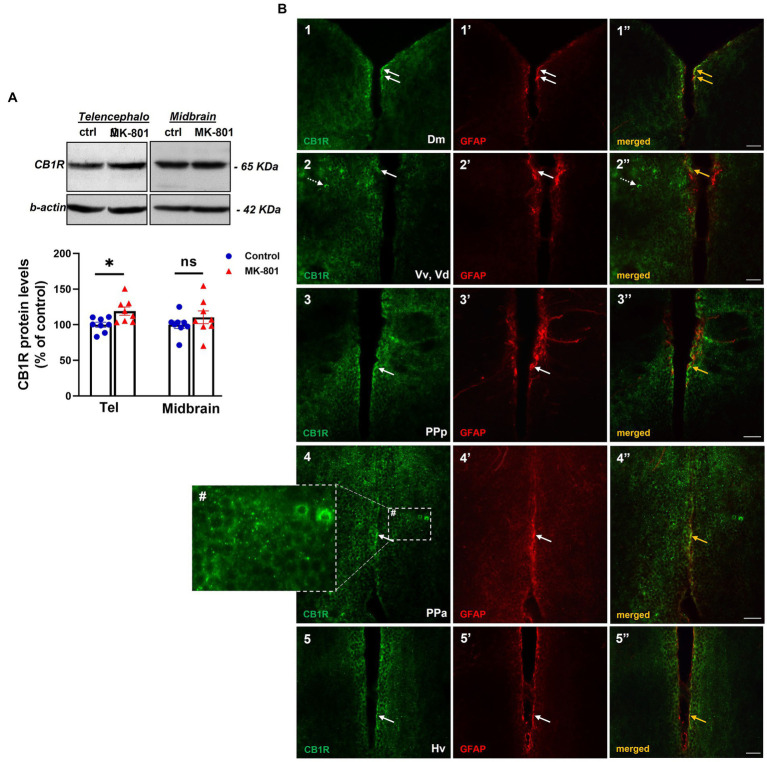
Figure 5
Altered endocannabinoid signaling in telencephalon of MK-801-treated zebrafish. (A) Representative blots and quantification of the relative expression levels of CB1R in telencephalon and midbrain. n = 8 per experimental group. Data are expressed as mean ± SEM. *p ≤ 0.05, ns, non-significant, compared to control group. (B1–5’’) Immunofluorescent microphotographs of selected transverse sections showing colocalization of CB1R with GFAP immunoreactive cells in the periventricular zone within different nodes of the SDMN. (B1–1’’) medial zone of the dorsal telencephalic area (Dm), (B2–2’’) ventral nucleus of the ventral telencephalic area/dorsal nucleus of the ventral telencephalic area (Vv/Vd), (B3–3’’) parvocellular preoptic nucleus, anterior part (PPa), (B4–4’’) parvocellular preoptic nucleus, posterior part (PPp), (B5–5’’) ventral zone of periventricular hypothalamus (Hv). Arrows indicate examples of colocalization, dashed arrows point to single positive cells. Within brain parenchyma, CB1R-immunostaining is intensively present in punctate structures around or in close proximity with cell somata (B4#). Microphotographic images are representative of MK-801-treated fish. Scale bar: 25 μm.