
|
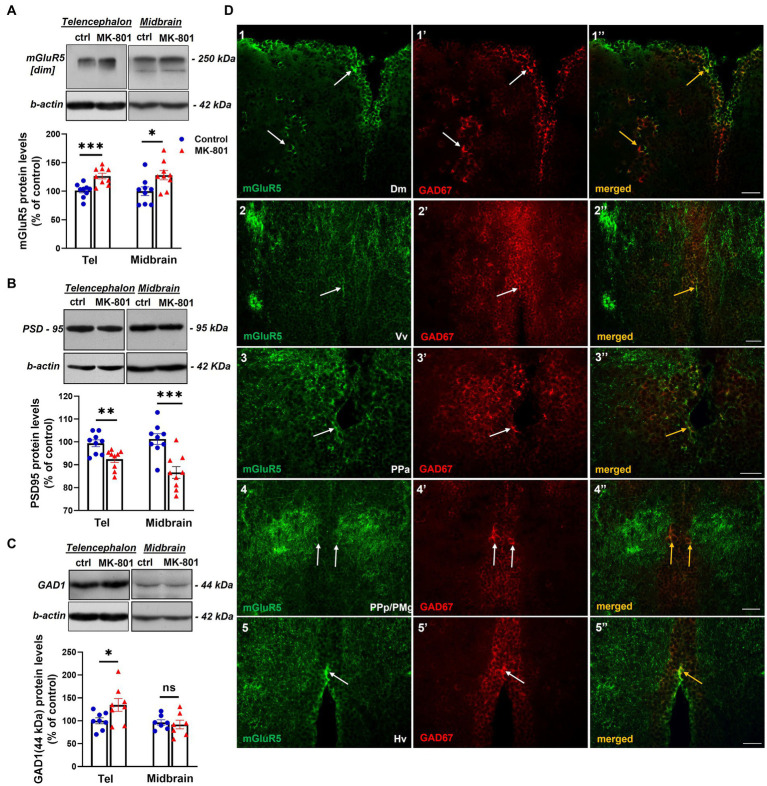
Figure 4
MK-801-treated zebrafish are characterized by altered expression levels of proteins involved in glutamatergic and GABAergic neurotransmission (A–C) Representative blots and quantification of the relative expression levels of (A) mGluR5, (B) PSD-95 and (C) GAD1. n = 6–7 (GAD1) or n = 9 (mGlur5, PSD-95) per experimental group. Data are expressed as mean ± SEM. *p ≤ 0.05, **p ≤ 0.01, ***p ≤ 0.001, ns, non-significant, compared to control group. (D) Immunofluorescent microphotographs of selected transverse sections showing colocalization of mGluR5 with GAD1 immunoreactive cells within different areas of the SDMN. (D1–1’’) medial zone of the dorsal telencephalic area (Dm), (D2–2’’)- ventral nucleus of the ventral telencephalic area (Vv), (D3–3’’) parvocellular preoptic nucleus, anterior part (PPa), (D4–4’’) parvocellular preoptic nucleus, posterior part/gigantocellular part of magnocellular preoptic nucleus (PPp/PMg), (D5–5’’) ventral zone of periventricular hypothalamus (Hv). Arrows indicate examples of colocalization. Microphotographic images are representative of both control (D1–1”,D3–3”,D4–4”,D5–5”) and MK-801-treated (D2–2’’) fish. Scale bar: 25 μm.