
|
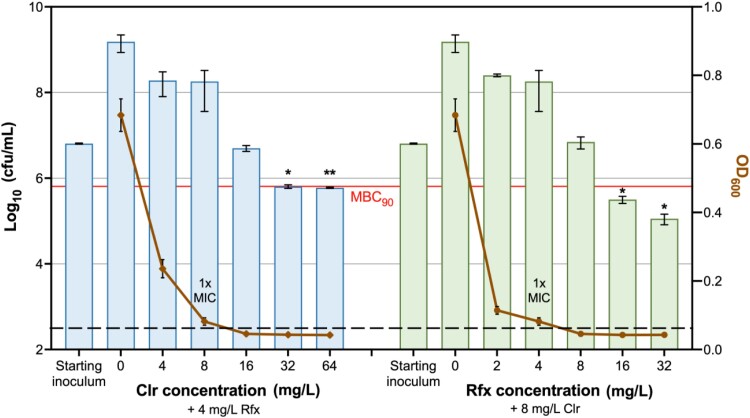
Figure 3.
MBC and MIC determination of the combination of clarithromycin (Clr) and rifaximin (Rfx) on M. abscessus ATCC 19977. The cfu counts were determined for the cells treated with 0.5×, 1×, 2×, 4× and 8 × MIC of clarithromycin in the presence of 1 × MIC of rifaximin, and vice versa. The MBC90 (orange line) was defined as the lowest drug concentration required to induce >90% cell death compared with the starting inoculum (at 0 h timepoint) of the untreated control. The number of residual log10 cfu/mL was determined through plating 10-fold serial dilution and compared with the starting inoculum. Statistical significance was determined by a two-tailed Student’s t-test with Welch’s correction; *P < 0.05; **P < 0.01. The dashed black line indicates the limit of detection. The experiments were carried out in duplicates; error bars represent the SD.