
|
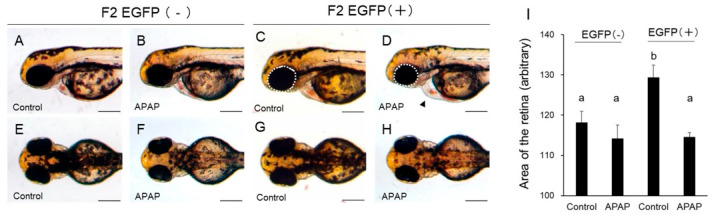
Figure 3
Acetaminophen-induced reduction in the size of the retina in rat CYP2E1-TG larvae. EGFP fluorescence-negative (EGFP [−]) and -positive (EGFP [+]) F2 CYP2E1-transgenic larvae were exposed to 2.5 mM acetaminophen (APAP) from 24 hpf to 54 hpf for capture of lateral and dorsal images. (A,B,E,F): EGFP [−] larvae. (C,D,G,H): EGFP [+] larvae. (I) indicates quantitative data of lateral area of the retina in the bar graph (n = 10). The retina was circled by white interrupted line for quantification for example (C,D). Scale bar: 200 µm. Bars with different letters in (I), (a, b) are significantly different (p < 0.05). Mild pericardial edema was indicated by arrowhead in D.