
Image
|
Figure Caption
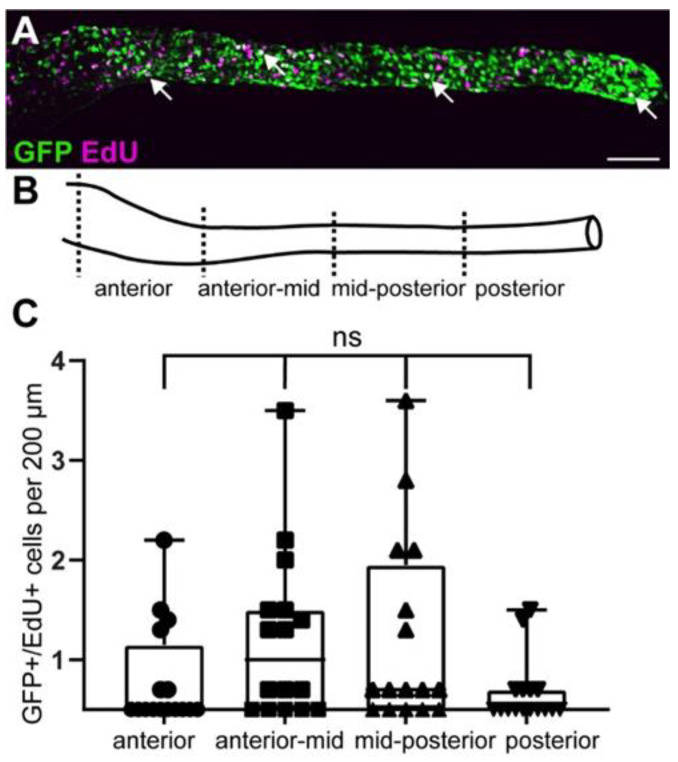
Figure 5 GFP+ cells include proliferating enteric progenitor cells at larval stages. (A) At 5 dpf, GFP colocalizes with EdU (white arrowheads). (B) Gut schematic indicates the four gut sub-regions analyzed. (C) Quantification of GFP and EdU colocalization in four gut regions shown in (B). Using one-way Anova, we did not find significant differences between the different gut regions. Box plot shows GFP+/EdU+ cells (2 experiments, 16 larvae). (A): maximum projection of dissected gut. Scale bar = 100 µm. ns not significant.
Acknowledgments
This image is the copyrighted work of the attributed author or publisher, and
ZFIN has permission only to display this image to its users.
Additional permissions should be obtained from the applicable author or publisher of the image.
Full text @ Int. J. Mol. Sci.