
|
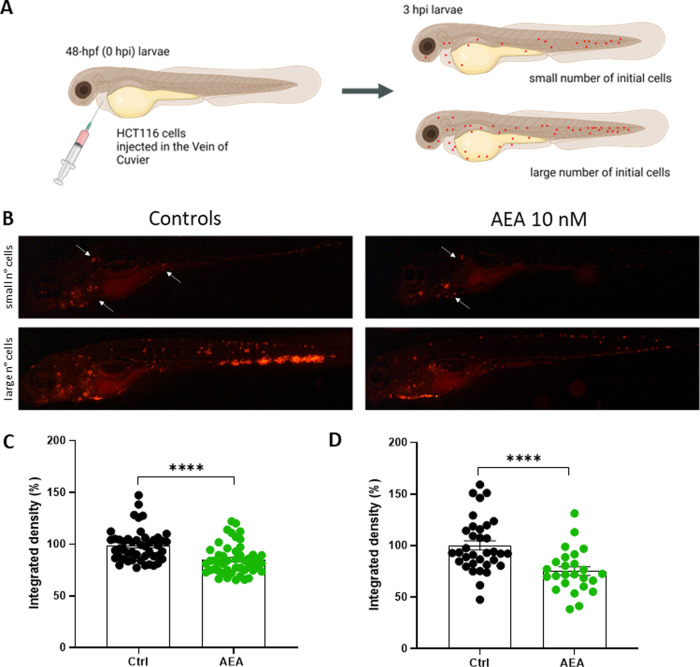
Fig. 3 A HCT116 cells were directly injected into the Vein of Cuvier of 48-hpf WT larvae. The image shows the experimental procedure and the division of xenografts considering the number of HCT116 circulating cells 3 hpi. Image created with Biorender.com. B Stereomicroscope Representative Images of 3dpi Ctrl- (on the left) and AEA exposed xenografts (on the right). White arrows pinpoint HCT116 cells in metastasis. C, D Integrated density of HCT116 metastatic tumor cells in 3 dpi zebrafish larvae injected with small (C) and large (D) numbers of cells. The mean value of the integrated density in Ctrl was set as 100%. The error bar indicates SEM. (Small: Ctrl n = 48; AEA n = 50. Large: Ctrl n = 34; AEA n = 25 from three independent experiments). Statistical analysis was performed using Student’s t-test. ****p < 0.0001.