
Image
|
Figure Caption
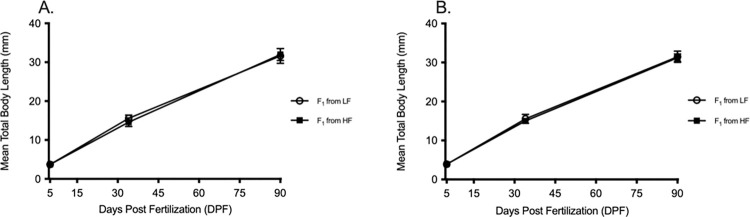
Fig 4
Growth Curves of two F1 wild-type lines from 5 to 90 DPF.
Growth curves for two F1 generation wildtype lines (offspring of F0), (A) AB and (B) Tü from 5 to 90 DPF. Slow growth curves are represented by mean ± standard deviation. Open circles = LF from F0 LF parents, closed squares = LF from F0 HF parents.
Acknowledgments
This image is the copyrighted work of the attributed author or publisher, and
ZFIN has permission only to display this image to its users.
Additional permissions should be obtained from the applicable author or publisher of the image.
Full text @ PLoS One