
Image
|
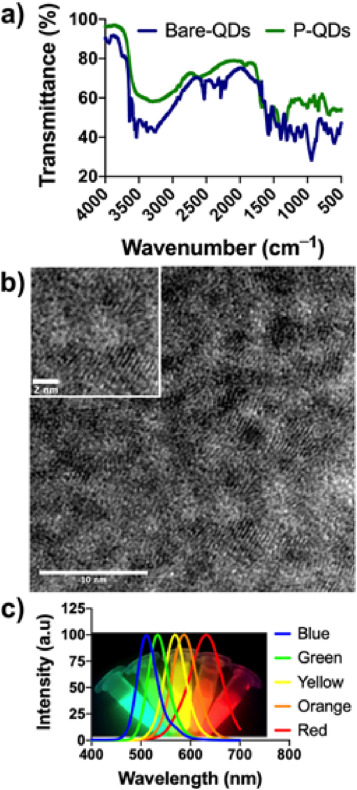
Figure Caption
Fig. 3 Fig. 3. a) FT-IR spectra of bare CdTe and PDMS coated CdTe QDs. b) TEM showing uniformly dispersed P-QDs with the size of ~3–5 nm. The inset of the image shows an enlarged image revealing atomic planes. c) Photoluminescence spectra recorded at an excitation wavelength of 320 nm. The background picture shows different colored P-QDs.
Acknowledgments
This image is the copyrighted work of the attributed author or publisher, and
ZFIN has permission only to display this image to its users.
Additional permissions should be obtained from the applicable author or publisher of the image.
Full text @ Mater Today Bio