IMAGE

Fig. 3.

ID
ZDB-IMAGE-220521-4
Genes
Antibodies
Source
Figures for Espinosa et al., 2022
Image
Figure Caption

Fig. 3.

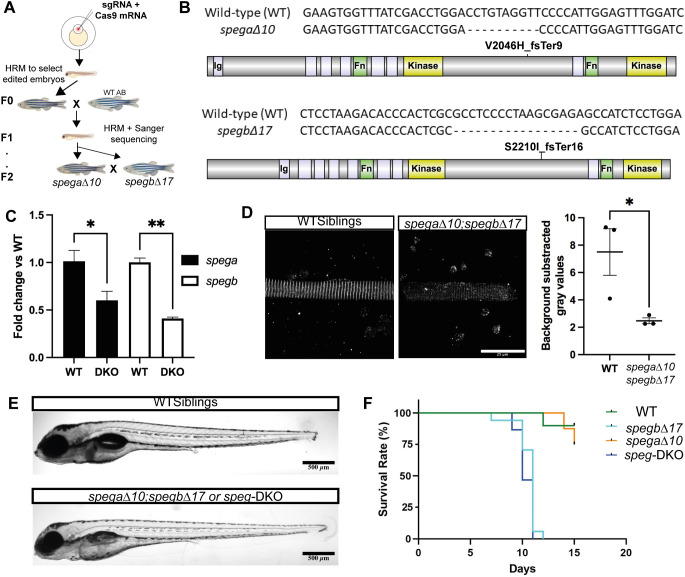
Generation of spega/b knockout zebrafish. (A) Schematic diagram showing the workflow of generating Speg single and double CRISPR-Cas9 mutants. gRNAs (against spega or spegb) showing high editing efficiency [as determined by high-resolution melting (HRM)] were co-injected with Cas9 mRNA into one-cell-stage embryos (AB strain), and the resulting larvae were raised to adulthood. These F0 zebrafish were then outcrossed to WT AB, and resulting embryos screened for germline mutation by HRM and Sanger sequencing. Larvae that showed nucleotide changes leading to premature stop codons were raised to adulthood (F1), i.e. spega single KO (spegaΔ10) or spegb single KO (spegbΔ17). To dilute off-target effects, F1 adults were outcrossed to AB WTs to generate F2 embryos and adults. Double KO lines (e.g. spegaΔ10;spegbΔ17) were then generated by crossing spega F2 heterozygous (+/−) adults to spegb F2 heterozygous (+/−) adults. (B) Genotypes and predicted protein products (if any) of the single mutant lines. spega-V2046H_fsTer9: V2046>H, frame shift and terminates nine amino acids downstream. spegb-S2210I_fsTer16: S2210>I, frame shift and terminates 16 amino acids downstream. (C) RT-qPCR analysis shows significant reductions (∼50%) in both spega (black bars) and spegb (white bars) mRNA transcript levels in spegaΔ10;spegbΔ17. Unpaired two-tailed Student's t-test: *P<0.05, **P<0.01. (D) Quantification of Speg protein levels as measured by immunofluorescence (IF; anti-Speg) intensity in 5 dpf myofibers isolated from WT siblings versus spegaΔ10;spegbΔ17. Each dot represents the average of gray values (technical triplicates) measured by the square tool in Fiji ImageJ. Three independent experiments were performed, and data are shown as mean±s.e.m. Unpaired two-tailed Student's t-test: *P<0.05. Scale bar: 25 µm. (E) At 6 dpf, morphology was similar between WT siblings and spegaΔ10;spegbΔ17 (or speg-DKO), although deflated swim bladder was noted in speg-DKOs. Scale bars: 500 µm. (F) Representative Kaplan–Meier curve showing reduced survival in spegbΔ17 (spega +/+; spegb-KO, light blue) and speg-DKO (spega-KO; spegb-KO, dark blue), but not in spegaΔ10 (spega-KO; spegb +/+, orange) or WT siblings (spega +/+; spegb +/+, green). spegb-KO and speg-DKO larvae have a median survival of 11 dpf and 10 dpf, respectively, and a maximum survival of 12 dpf and 11 dpf, respectively. n=10 WT, n=17 spegb-KO, n=16 spega-KO and n=15 speg-DKO. Mantel–Cox test.

Figure Data
Acknowledgments
This image is the copyrighted work of the attributed author or publisher, and ZFIN has permission only to display this image to its users. Additional permissions should be obtained from the applicable author or publisher of the image. Full text @ Dis. Model. Mech.