IMAGE

FIGURE 4

ID
ZDB-IMAGE-220413-19
Genes
Antibodies
Source
Figures for Wei et al., 2022
Image
Figure Caption

FIGURE 4

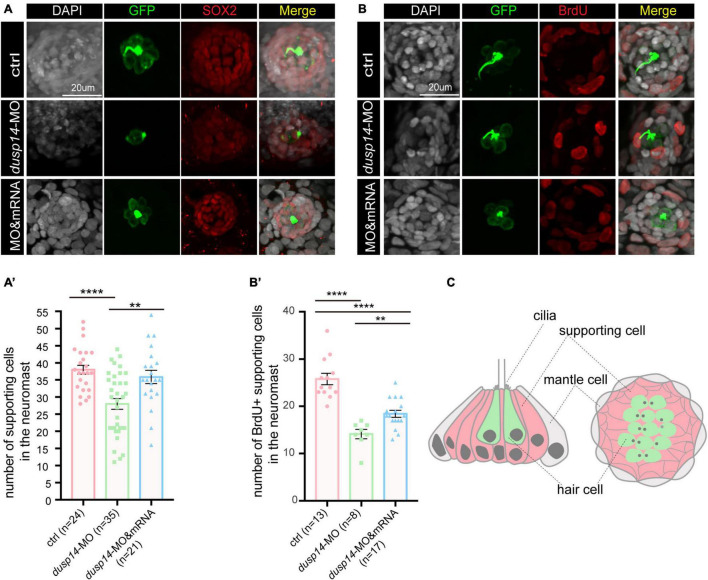
Knockdown of the dusp14 gene reduces the number of supporting cells and proliferation of supporting cells. (A) The representation of SOX2 immunofluorescence images of neuromasts in the posterior lateral line of the control and dusp14 morphants. (A′) Quantification of the number of supporting cells in the posterior lateral line neuromast of control and dusp14 mutants at 72 hpf. (B) BrdU staining for the supporting cell in the neuromasts in the posterior lateral line of the control zebrafish and dusp14 morphants. Scale bar = 20 μm. (B′) Quantification of zebrafish embryos with the BrdU+ cells in the control and dusp14 morphants. (C) Schematic diagram of the longitudinal structure and the plane structure of neuromast, the gray part is the mantle cell, the pink part is supporting cell, and the green represents hair cell. Experimental embryos were sampled at 72 hpf (n > 8). Each bar represents the mean ± SD. Values with ** and **** above the bars are significantly different (P < 0.01 and P < 0.0001, respectively).

Figure Data
Acknowledgments
This image is the copyrighted work of the attributed author or publisher, and ZFIN has permission only to display this image to its users. Additional permissions should be obtained from the applicable author or publisher of the image. Full text @ Front. Cell. Neurosci.